Select Page

NoiseSpotter®

Gather the data you need to characterize environmental risk from underwater noise.

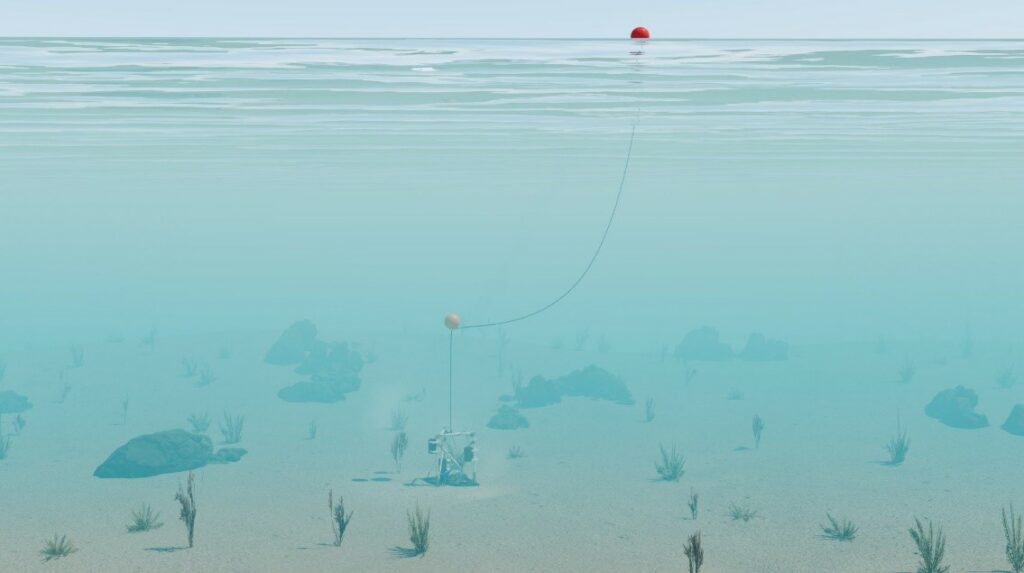
NoiseSpotter® (U.S. patent 11,156,734) is the first state-of-the-art commercial vector sensor array that measures and locates underwater sound sources in near real time. NoiseSpotter® provides measurements of acoustic pressure and particle motion from underwater sounds, including marine mammal activity. Now regulators, stakeholders, and developers can detect, identify, distinguish, localize, and monitor underwater sounds (including locating sound sources) to learn more about the environmental acoustic effects of activities beneath the sea—from underwater construction to installation of offshore and marine renewable energy devices.

Features

  • Robust Sound Pressure/Particle Motion Data
  • Flow Noise Suppression
  • Source Localization
  • Real-Time Characterization/Reporting
  • Directional Soundscape Characterization

Use Cases

  • Regulatory
    • Environmental Impact Statements
    • Real time reporting to support mitigation measures
    • Monitoring for illegal fishing activity
  • Scientific research
    • Estimating and tracking marine mammal distribution and density
    • Acoustic propagation model validation
    • Particle motion effects on fishes and invertebrates
  • Soundscape characterization
    • Biophony (e.g., fish choruses, marine mammal vocalizations)
    • Geophony (e.g., seismic and volcanic activity)
    • Anthrophony (e.g., shipping, pile driving)

About NoiseSpotter®

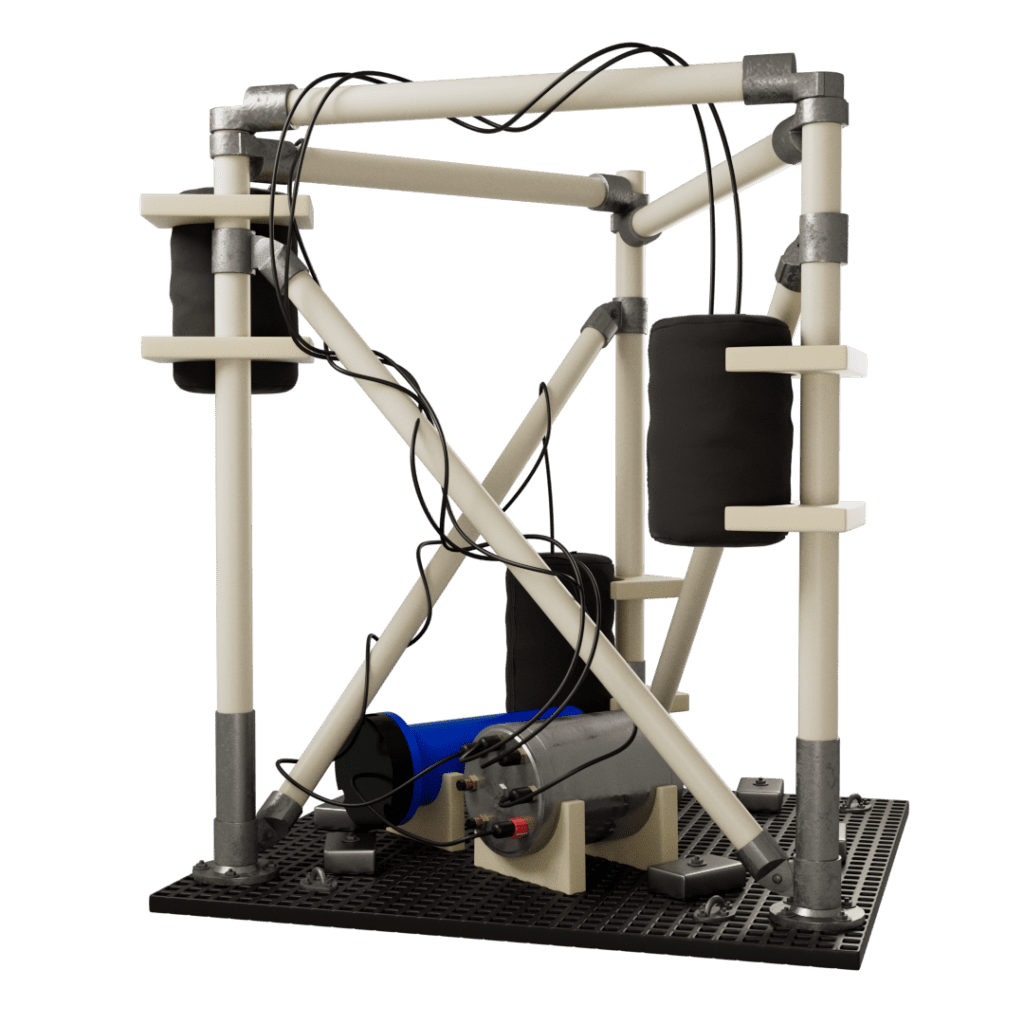
Operational since 2018. Developed by Integral Consulting Inc. in collaboration with H.T. Harvey & Associates, Noise Control Engineering, Proteus Technologies, and Sandia National Laboratories. NoiseSpotter’s® 3-dimensional (3D) acoustic vector sensor array measures pressure and particle motion at each sensor location. Time synchronized data logging allows for coherent processing such as beamforming to accurately obtain the location of a source of sound. NoiseSpotter® also provides real-time telemetry of key data metrics such as sound pressure levels and sound spectra to a cloud-based server to support monitoring requirements and mitigation measures, and to facilitate further processing such as source localization.

Why NoiseSpotter®

Traditional acoustic sensing techniques involve the use of hydrophones that measure scalar acoustic pressure which provides no information about the direction or source of a sound. The NoiseSpotter® utilizes vector sensors which measure both acoustic pressure and 3D acoustic particle velocity. The vector measurement of particle velocity inherently provides directional information (acoustic bearing) to a source of sound.
Additionally, many marine animals such as fishes and sea turtles experience sound through its particle velocity component rather than acoustic pressure. NoiseSpotter® measurements, therefore, help to understand the effects of anthropogenic sound on fish behavior.

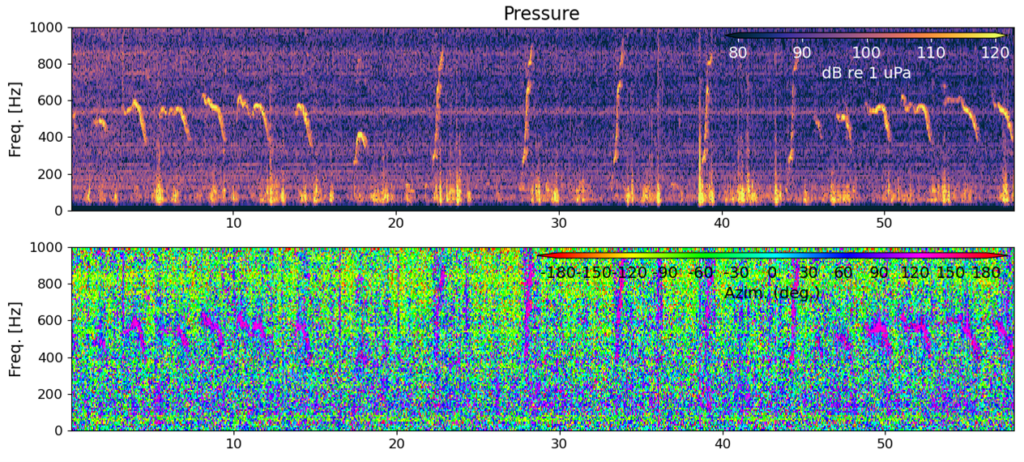
What is a spectrogram?

A spectrogram is a visualization of sound over various frequencies as it varies with time. Time is in the x-axis and the y-axis presents sound frequency, where lower frequencies represent lower pitched sounds and higher pitched sounds are at higher frequencies. Different colors on the spectrogram show the intensity of sound, or how loud they are. Colors in yellow represent louder sounds and dark purple colors represent quieter sounds.

How do I interpret this spectogram?
Here, you are looking at a 1-minute block of time over which humpback whale vocalizations were recorded. The whale vocalizations are seen as bright yellow, squiggly lines. You can imagine how it sounds by just looking at this spectrogram. The whale starts its song with a short burst at mid-pitch, then sings a short tune that starts at mid-pitch and drops to a low pitch. This same, short tune repeats itself about four to five more times before it sings a different tune that starts at a low pitch and ramps up quickly to a high pitch. This tune is repeated four more times before it goes back to the other mid-pitch to low pitch tune.

What is an “azigram”?

An azigram displays directional sound information as a function of time and frequency. It is similar to a spectogram but instead of the colors representing sound intensity, they represent the direction from which the sound originates, relative to the NoiseSpotter®.

How do I intepret this azigram?
This is the azigram that accompanies the humpback whale vocalization spectrogram above. You can still identify the different whale tunes as squiggly lines. However, these lines are now shown in bright magenta, which according to the legend in the upper right corner of the figure, indicate that the whale’s location was at an azimuthal angle of approximately 120° from the NoiseSpotter®, meaning that this whale was to the southwest. Here, -180° and 180° are both to the south (hence they are both the same color – red), -90° is due west, 0° is directly north, and 90° is to the east.

Spectrogram (top) and “Azigram” (bottom) of humpback whale vocalizations as measured by the NoiseSpotter®. Click on each figure panel to learn more.


Audio clip of the CalWave Wave Energy Converter

Specifications

The NoiseSpotter® features a small (4 × 4 × 4-ft) three-sensor array, with each sensor measuring acoustic pressure and particle velocity to geolocate sources of sound more efficiently. Each sensor is housed inside a flow noise suppression shield to improve signal-to-noise for collection of robust acoustic data in energetic conditions.

Frequency range50 Hz to 3 kHz
Acoustic fieldsPressure
3D particle motion
Number of sensors3
Vertical spacingCustomizable
Typically 25 cm, 50 cm, and 75 cm above seabed
Horizontal spacingCustomizable
Typically 1.25 m
Sampling rateUp to 25 kHz
Typically 10 kHz
Operating duration3 weeks continuous recording at 10KHz
Telemetry optionsCustomizable
Currently sound pressure levels and 10 s spectra every minute
Depth rating200 m
Intended applicationsSoundscape characterization, marine mammal monitoring, particle motion measurements, source localization and tracking

Particle velocity is our jam.

NoiseSpotter® is available for lease for a daily fee. We provide insurance at no extra cost. The system can be shipped anywhere around the globe. For more information, contact Kaus Raghukumar, Ph.D., at  kraghukumar@integral-corp.com or (831) 576 2876.

Case Studies

20211122_070833

CalWave, San Diego

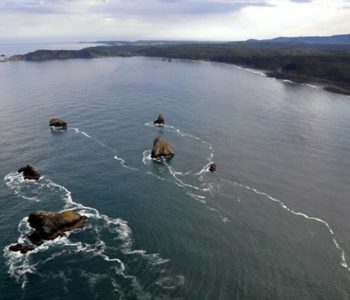
Redfish-Rocks-Marine-Reserve

National Science Foundation

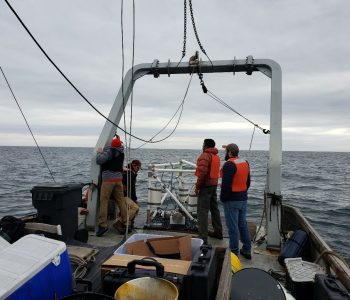
NoiseSpotter Testing

Office of Naval Research—Vandenberg Space Force Base and Los Angeles International Airport (LAX)

Publications

Raghukumar, K., G. Chang, F.W. Spada, and C.A. Jones. 2019. NoiseSpotter: A rapidly deployable acoustic monitoring and localization system. D. Vicinanza et al. (eds), In Proc. of the 13th European Wave and Tidal Energy Conference, Naples, Italy.

Raghukumar, K., G. Chang, F. Spada, C. Jones, J. Spence, S. Griffin, and J. Roberts. 2019. Performance characteristics of a vector sensor array in an energetic tidal channel. pp. 653–658. J.S. Papadakis (ed), In Proc. of the Fifth Underwater Acoustics Conference and Exhibition, Crete, Greece.

Raghukumar, K., G. Chang, F. Spada, and C. Jones. 2020. A vector sensor-based acoustic characterization system for marine renewable energy. J. Mar. Sci. Engr. 8(3):187. doi:10.3390/jmse8030187.

Chang, G., Harker-Klimeš, G., Raghukumar, K., Polagye, B., Haxel, J., Joslin, J., and Spada, F. 2021. Clearing a path to commercialization of marine renewable energy technologies through public-private collaboration. Frontiers in Marine Science, 8:669413.

Borland, L.K., Heppell, S.A., Chapple, T.K., Raghukumar, K., Henkel, S.K. 2023. Responses of Oregon Demersal Species to Seismic Survey Noise: Evaluating Behavior and Movement. In: Popper, A.N., Sisneros, J., Hawkins, A.D., Thomsen, F. (eds) The Effects of Noise on Aquatic Life. Springer, Chamhttps://doi.org/10.1007/978-3-031-10417-6_18-1.