
White Paper
Considering Environmental Justice in Natural Resource Damage Assessment: Injury to Recreation Resources
By Theodore D. Tomasi, Ph.D., Senior Principal
Abstract
Determining the amount of restoration needed to compensate the public for injury to natural resources is central to estimating natural resource damages (NRDs). Formal restoration scaling methods have not considered environmental justice to date. The traditional approach equates the aggregate economic value of restoration to the aggregate value of injury without considering ethically relevant differences in the persons to whom the value attaches. This paper discusses the inclusion of environmental justice in formal restoration scaling models for injury to recreation resources. The approach incorporates the possibility that restoration can both compensate the public and effectuate a transfer from the resource rich to the resource poor, reducing inequality. It is shown that relatively minor deviations from current practice allow environmental justice to be incorporated in the computations by 1) modifying how recreation-demand data are used to estimate measures of individual well-being, and 2) generalizing the way the individual measures are added across people into an index of social welfare. Restoration is scaled when social welfare with the injury and restoration is equal to social welfare at baseline. The social benefit of reducing inequality is included in the benefits of restoration, which leads to a reduction in the physical amount of restoration needed to compensate the public relative to traditional scaling methods. A functional form for the social welfare index is specified that has a free parameter governing social sensitivity to unequal distribution of recreation resources. Indirect evidence on the likely range of this parameter shows that when environmental justice is formally considered, the unit value of restoration relative to the value of injury may be increased substantially over the traditional approach.
1I wish to acknowledge helpful comments from David Anning, Heath Byrd, George Parsons, and Miranda Henning, while absolving them of remaining errors and opacities.
Introduction
Natural resource damages (NRDs) associated with releases of contaminants to the environment equal the cost of resource restoration projects, the benefits of which offset injuries to natural resources. The key issue for the magnitude of damages is identifying the type and amount of restoration needed to redress the harm; this is called restoration scaling. In this paper, I outline an approach to scaling that builds environmental justice into the computations using a social welfare function that includes considerations of equity in outcomes. This contrasts with the traditional approach, called value-to-value (VtoV) scaling, in which injury is quantified by the economic value of recreation trips lost, and the benefits of restoration are quantified similarly for trips gained. Restoration is scaled when these economic values are equated. The approach identified here augments the traditional economic value to include a social benefit for reducing inequality; I call this “social value-to-social value” (SVtoSV) scaling.
To include substantive environmental justice considerations in the estimation of NRDs means that methods employed take into account ethically relevant differences in persons affected by injury to natural resources and the restoration used to redress the harms. NRD restoration can then simultaneously compensate the public for injury and reduce inequality. The latter objective can be effectuated by designing restoration to create a
transfer from the relatively resource rich to the relatively resource poor, for example, by locating restoration in a community that is relatively deprived of recreation resources at baseline. I focus here on impacts to recreation resources; a companion paper addresses ecological service losses that are not the object of direct human uses.
The existing natural resource damage assessment (NRDA) process can accommodate consideration of environmental justice in several ways. First, the NRDA process can involve targeted outreach via which the expressed interests of disadvantaged persons become heard in the NRDA process. This procedural justice contrasts with substantive justice considerations, which evaluate the outcome of the NRDA process (the amount and type of restoration). The second way NRDA could include environmental justice is to do so informally by adding fairness of outcomes as an evaluative criterion to others, such as nexus and costeffectiveness, used to guide restoration project selection. This approach potentially leads to a mismatch between 1) assumptions made in methods to estimate the magnitude of NRDs about how the monies collected from responsible parties are to be spent, and 2) how the monies actually end up being spent. Biased estimation of NRDs can result when such mismatches occur. In the third possibility, which I discuss, the potential mismatch is eliminated by formally embodying environmental justice into the scaling methods. In this approach, computations of the value of service losses and gains reflect concerns for environmental justice.
An extensive economic literature exists on measuring inequality and embodying fairness into evaluation of public policies (see Adler and Fleurbaey 2016 for an overview). The approach I explore here is as close to current NRDA practice as I can make it, and implementing it would involve a minimal set of deviations from the analyses typically undertaken to address recreation in NRDAs.
I develop a stylized thought experiment to discuss environmental justice issues in NRDAs for human use. My intent is to provide insight into the issues involved, not to present revised computational models for application in cases, which is a highly technical matter. This paper is addressed to NRD practitioners not trained in economics, but familiar to a degree with recreation economics as usually applied in NRDA. That said, the analysis is formal in that it uses a model very much in the spirit of real applications, and NRDA economists will be able to make the mental adjustments to bring the concepts discussed here into practice should they chose to do so.
Taking the viewpoint of evaluating NRDA policies, I identify circumstances in which considering environmental justice may conflict with restoration criteria favoring nexus and cost-effectiveness of restoration. The approach to including justice considerations directly in scaling provides a way to integrate these criteria.
A Simple Regional Model of Injury and Restoration
The model I develop is designed to provide policy-level insights. It eliminates unnecessary complications that would be needed in empirical applications, but may serve to obscure policy implications. Imagine several geographically distinct communities with local-access recreation sites such that people don’t travel across communities to visit them. This assumption means I don’t need a complicated model of how many trips people take to many recreation sites. The recreation sites are of the same quality, but the acreages available at baseline differ across communities.
There are two time periods. The sequence of events is as follows.
- In the beginning of the first period, a spill of oil or release of a hazardous substance renders unusable a portion of the available recreation acreage in one community, called 𝑖. Community 𝑖’s baseline acreage of recreation sites, denoted 𝑄𝑖𝐵, is reduced by an amount of injury ∆𝑖𝐼. Injury is constant until it is remediated.
- In response to the event, the recreation site is cleaned up and the area restored to its prior condition. This takes place at the end of the first time period and instantaneously returns community 𝑖’s recreation acreage to baseline conditions
- The NRDA takes no time to complete. The process identifies compensatory restoration for the interim loss of recreation services from the time of the release to when the recreation site is back to baseline conditions.
- The restoration project is implemented in the beginning of the second time period, provides benefits instantaneously that are constant for one period, and then evaporates
- The restoration takes place in community 𝑟, adding an acreage amount ∆𝑟𝑅 to that community’s baseline acreage, 𝑄𝑟𝑅. The cost of restoration in community 𝑟 is 𝐶𝑟.
- The discount rate is zero.
These simplifying assumptions allow me to concentrate on core issues of environmental justice; relaxing them alters the details of implementation but not the basic ideas I address.
I make one substantive simplifying assumption that people in the communities are identical in all regards except for their access to recreation resources. This renders the environmental justice problem unidimensional and it is therefore much simpler to understand the principles involved. If there were other dimensions of inequality, for example, in incomes, health status, or education, multidimensional extensions can be made (see, for example, Chakravarty 2018), but these are technically complex, which may obscure the main points. I comment on the potential extensions briefly below.
The problem faced by the natural resource trustees (government agencies entrusted with conducting the NRDA on behalf of the public) is to select a location and amount of restoration, the combination of which I call a restoration “project.” The trustees must choose one project from among the feasible alternatives; making this choice is called restoration scaling.
Project selection is guided by various evaluative criteria. I will examine five.
- Compensation of the public (PC): The public is compensated when it is at least as well off with the combination of injury and restoration as it would have been at baseline.
- Nexus between services injured and restored (SN): The resource restored provides services that are similar in type and quality to those injured.
- Nexus between people injured and restored (PN): The resource restored provides services to the same set of persons as the set of persons injured.
- Cost-effectiveness (CE): Given a set of projects that all meet a specified goal, the one doing so at least financial cost is preferred.2
- Substantive environmental justice (SEJ): Restoration that reduces inequality across persons is preferred,all else equal.
Below, I discuss the traditional approach to scaling restoration for recreation in NRDA, which includes the first four criteria, and the implications this approach has for the fifth SEJ criterion. Then, I turn to a new approach that builds EJ into the scaling process.
2 NRDA does not consider the opportunity cost of funds spent on restoration, so this statement needs qualification, as shareholders of the firm responsible for paying NRDs are worse off, and the general public is as well to the extent that restoration costs are passed through to consumers via higher prices. On this “failing” of NRDA, see Brown (1993).
The Traditional Approach to Scaling
The traditional approach to scaling restoration for injury to recreation resources gives primacy to the CP criterion and implements it via VtoV scaling. In terms of the simple model above, VtoV scaling 1) estimates the aggregate economic value of the lost recreational trips to the public in the first time period and 2) finds a set of restoration projects that increase the aggregate value of recreational trips in the second period in an amount equal to the loss.3 Economic value in each of these analyses is measured in two steps. First, individual value is measured as either a personal willingness to pay (WTP) to obtain a benefit (or avoid a harm) or the willingness to accept (WTA) compensation to forego a benefit (or endure a harm).4 While WTP and WTA measures may in general differ, I will assume they are the same.5In the second step, aggregation of individual values across people is then needed to identify restoration that compensates the public as a whole. Importantly, this is done as a simple (unweighted) summation in the traditional analysis.
This traditional approach is based on six important assumptions. First, restoration is judged according to the outcomes experienced by members of the public (scaling is consequentialist). Second, consistent with acting on behalf of the public, trustee determinations are based on how the individual members of the public judge those outcomes in terms of their view of their own well-being (scaling is welfarist).6 Third, when estimating individual values for recreation, it is assumed that all the things that matter to individuals are reflected in the number of trips taken to a recreation site (individual welfare from recreation is self-interested). Thus, no other information is needed for scaling, such as how each person judges the fairness of the distribution of recreation site acres across communities or whether there are better ways to achieve overall environmental justice objectives than by altering NRDA restoration. Fourth, if people care about such issues, these are distinct considerations related to individuals’ “public preferences” that do not affect how many trips they take to recreation areas (the NRDA scaling question is separable).7 Fifth, individuals’ self-interested well-being can be revealed by observing choices made regarding recreation trips, a choice made by trading off other market goods that could be purchased for trips.8 This requires both that that choice is aligned with self-interest, and that people know the attributes of the places they visit (choice is informed). Sixth, aggregation across individuals is via a simple unweighted summation, with a dollar of WTP or WTA treated the same regardless of the status of the person to whom it attaches (scaling of trip values is utilitarian).
I now turn to details of the traditional approach
3 In some NRD cases, restoration for injury to recreation is scaled by measuring the economic value of the losses and then spending this much on restoration. This approach, called value-to-cost scaling, typically leads to biased estimation of NRDs and is not considered here; see Byrd and Tomasi (2021) for a discussion.
4 This definition is explicit in the NRDA regulations promulgated pursuant to the Oil Pollution Act (15 CFR § 990.30)
5 WTP equals WTA when the number of recreation trips taken does not vary with individuals’ money income. Empirical recreation demand models often are consistent with this requirement.
6 To clarify, my approach is based on individuals’ well-being as derived from the resources available to them. It is not based on measures of subjective well-being, for example as derived from happiness or satisfaction surveys.
7 This is related to the concept of “weak complementarity,” which states that if a person is taking no recreation trips, a change in recreation resources available to them doesn’t affect their personal well-being (assuming they take no trips after the change as well). This rules out sources of value distinct from use and is needed for measures of individual well-being to be derived from recreation demand models. Bockstael and McConnell (2007) provide a detailed discussion.
8The traditional analysis described here is called a “revealed preference” method, where the choices made by people are used to infer their values. The self-regarding assumption seems reasonable—people don’t generally take more or fewer recreational trips to a site based on their views of the fairness of the overall array of recreation (and other) opportunities for everyone else. If a “stated preference” approach were used in which a ranking of projects, or WTP for them was elicited in a survey, this assumption of self-interested preferences would not necessarily hold.
Measuring Individual Well-Being
My model imagines that each community faces a travel cost per recreation trip that depends on the amount of recreation site acreage—a greater number of acres means that people do not have to travel as far to get to recreation sites and the average cost of recreation travel goes down. Let 𝑝𝑛 = 𝑝(𝑄𝑛) be the price (travel cost) in community 𝑛, where if 𝑄𝑛 goes up 𝑝𝑛 goes down, and vice versa. People are assumed to make a rational tradeoff between enjoying additional trips or taking fewer trips and saving the travel money to spend on other things. The number of trips taken in community 𝑛, denoted by 𝑇𝑛, therefore depends on the cost of travel. The functional relationship 𝑇𝑛 = 𝑇(𝑝𝑛) is called a demand curve for recreation. Because the people in different communities face a different price by virtue of having more or less recreation site acreage, a statistical analysis of trip-taking in the different communities can reveal the demand curve for trips. This is the essence of the widely used travel cost model of recreation demand. A recreation demand curve is shown in Figure 1.
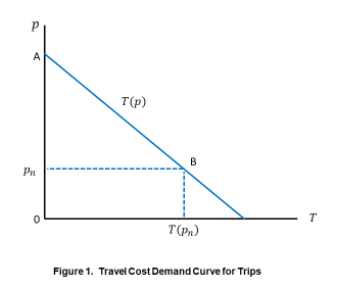
Importantly, the demand curve reveals a willingness to trade a little less money (the travel price) for one more trip; this defines the incremental (marginal) WTP for one more trip. Marginal WTP declines as more trips are taken. Suppose someone is provisionally anticipating taking some number of trips less than 𝑇(𝑝n) in Figure 1. In this area, the incremental WTP from taking one more trip (read off the demand curve) is greater than the travel cost (the dotted line). Hence, another trip is worth taking. As more trips are taken, marginal WTP declines until the two are equal at 𝑇(𝑝n). At that point, taking one more trip provides less incremental well-being than does spending the money on something else and so that next trip is not taken. 𝑇(𝑝n) is the quantity of trips taken in community 𝑛 when the price is 𝑝n.
By adding up marginal WTP across all the trips taken, one computes the total WTP associated with the price 𝑝n. This is the area under the demand curve in Figure 1, given by the area 0AB 𝑇(𝑝n). If the recreation sites in the community were to disappear, the total WTP is lost, but the portion corresponding to expenditures, the box 0𝑝nB 𝑇(𝑝n), can be spent on something else. The net loss of WTP is the triangle area 𝑝n𝐴𝐵. This net WTP is the value of having the site available versus it not being available and is called consumer surplus.
The change in consumer surplus from a change in prices of recreation is the WTP for that change. With the loss of acres in the injured community, the price will rise there (leading to a reduction in consumer surplus) and the price will fall with the additional acres in the restored community (leading to an increase in consumer surplus). This is shown in Figure 2.
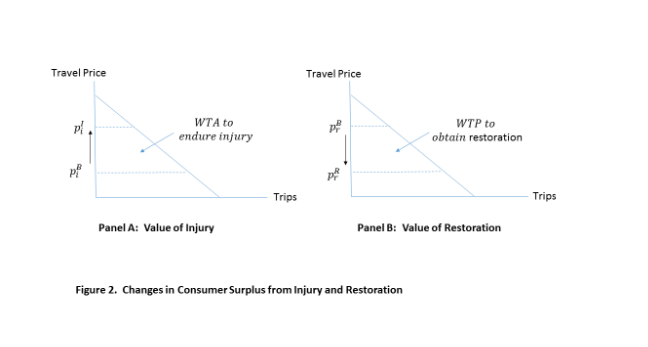
In Panel A of Figure 2, injury increases the travel cost and reduces consumer surplus; this is WTA to endure the harm (a negative WTP). In Panel B, restoration reduces travel cost and increases consumer surplus. This is a positive WTP to obtain the restoration.
Aggregation of Well-Being and Compensating the Public
The SN criterion would select a project type that is related to the injury. This is not technically required, as monetization of benefits from any restoration could in principle be compared to monetized injuries. However, I will assume henceforth that restoration enhances the same opportunities as those injured and so only one demand curve needs to be estimated and WTP/WTA can be computed from the curve.
Having picked a community 𝑟 in which to locate restoration, the traditional analysis implements the PC criterion by adjusting the scale of restoration ∆𝑟𝑅 such that the unweighted sum of the WTP for benefits of restoration (in Figure 2, Panel B) equal or exceed the unweighted sum of WTA to endure the injury (in Figure 2, Panel A).
This is called the Kaldor-Hicks test. All that matters is the summed WTP/WTA numbers. The test for whether a project satisfies PC reduces to whether the WTP to obtain the restoration in community r allows that community to make a compensatory payment to those in community 𝑖 at least as great as community 𝑖’s WTA to endure the injury and still have something left over. By the assumptions that well-being derived from recreation trips is self-interested and separable, there are only two affected communities. If the compensation is actually paid, those in community 𝑖 are no worse off than at baseline (because they received their WTA) and those in community 𝑟 are also no worse than at baseline (and are better off if the something left over is strictly positive). The public as a whole has been compensated. Of course, in actual NRDAs, such compensation does not actually take place, as no money changes hands. In the traditional NRDA, the mere potential for such compensation is used to conclude that PC has been met 9 Community 𝑖 is actually worse off than at baseline, and community 𝑟 better off. With aggregation implemented as simple sum of WTP and WTA, this does not matter to scaling. There will be many projects that satisfy the PC criterion. In particular, if a project satisfies PC then so will a larger version of that project. Moreover, the restoration could be placed in any community and scaled so as to satisfy PC via the Kaldor-Hicks test. Other criteria are used to select from the large set of projects satisfying PC
Project Selection Criteria
The CE criterion10 would dictate that the trustees should minimize the cost of restoration, subject to the requirement that the Kaldor-Hicks test is passed. This would seek to make the sum WTP as close as possible to WTA by adjusting project size. This would be true irrespective of where the restoration is located. The CE criterion also has implications for siting the restoration project if restoration costs differ across communities.
CE does not affect the siting decision if the costs of restoration are the same in all communities. In this case, the trustees may as well invoke criterion NP and site the project in the injured community. When aggregation across people is a simple summation, there is no formal justification for the nexus criterion; it may arise out of some idea of fairness to those injured and be imposed in project identification but is not part of the formal scaling rule. In the simple model presented here, it would ensure that those harmed are fully compensated, and all others are neither under- nor overcompensated. It would also ensure that the post-restoration distribution of park aces is the same as at baseline. This would satisfy EJ viewed as a constraint, with no additional social welfare conferred by an actual reduction in inequality.
9 See Parsons and Kang (2010) for an example of the Kaldor-Hicks test of compensatory restoration in a more elaborate recreation demand model.
10 Effectiveness here means compensating the public; one should implement a project with lower costs but only if it is in the set of projects that achieves full compensation. Less-than-full compensation is not allowed, even if there is a better way to use project funds to increase public well-being outside of NRDA; that is, projects do not have to pass a benefit–cost test. See also footnote 8.
Suppose costs are not equal and that the cost of restoration in the injured community 𝑖 is greater than the cost in some other community called 𝑟. Now there is a conflict between NP and CE. Invoking NP and siting the project in a community with higher restoration costs is economically inefficient. This means the following rearrangement could make everyone better off. The lower-cost community 𝑟 could collect its exact WTP for the restoration project and give it to community 𝑖; community 𝑟 would be as well off as at baseline. Community 𝑖 would accept this amount in trade for the injury and be as well off as at baseline. What is left over after this trade is the difference in restoration costs, which could be divided among all the communities and spent on restoration, making everyone in the population better off.
In this sense, an inefficient policy that violates PC implies that the mean (average) of the distribution of recreation site acreage is smaller than it could be; this is an implicit destruction of recreation resources. Viewed thusly, the cost-effectiveness criterion is pretty compelling, and I believe that departures from it need clear and defensible justification. In the circumstance described, CE conflicts with PN. Of course, one justification for downplaying CE is that the trade described above, while available in principle, is not implemented in practice.
The CE criterion places the project in the community with the lowest restoration costs, potentially violating PN. This may or may not be consistent with the SEJ criterion. Communities with low costs of restoration may be places that are recreation site-deprived at baseline. Thus, the most disadvantaged community regarding accessibility to recreation sites might be the one selected by CE. Also, being disadvantaged in the dimension of access to recreation sites may be correlated with other dimensions of disadvantage (although this has been assumed away in the model here).11 Finally, an argument could be made that rigorously applying CE enhances procedural fairness by undercutting the ability of advantaged communities to successfully advocate for siting restoration with them. This is the flipside of reasons that have been identified in the environmental justice literature for why facilities with negative environmental outcomes get sited in disadvantaged communities.12
Assume now that CE is set aside despite differences in costs, and, in accord with PN restoration is located in community 𝑖. What if 𝑖 is a particularly advantaged community at baseline? While PN may seem fair to those harmed, SEJ might point toward locating restoration in a community disadvantaged at baseline. This would transfer resources from the resource richer to the resource poorer and should lead to an increase in a measure of overall social well-being that prioritizes the interests of the disadvantaged. If that disadvantaged community 𝑟 is also a place of high restoration costs due to unavailability of suitable space, there is now a distinct tradeoff to be made between equity and efficiency. Society can reduce the average amount of recreation site acreage (by virtue of spending too much, relative to locating a site in an area with lower restoration costs), but gain a reduction in inequality.
11 SN might be reasonably applied to rule out restoration for injury to recreation via, say, providing better access to healthcare or early childhood education. However, this would not seem to rule out considering correlation to other measures of disadvantage when siting a recreation restoration project.
12 For a similar argument that equity in CERCLA cleanup decisions would be enhanced by using benefit cost analysis, see Viscusi (2001). I disagree with Viscusi regarding his argument that fairness is achieved by mirroring market transactions because he doesn’t start market trades from a fair division of the social endowment of goods. But, I do agree that there are procedural and transparency benefits from attending to a cost-effectiveness criterion
Bringing an environmental justice perspective to the project selection rule will help provide a reasoned basis for assessing whether making an inequality-reducing transfer, at the cost of a loss in efficiency, is consistent with overall social well-being.
Justice in the Traditional Analysis
Setting aside the PN criterion, does the traditional analysis pay any attention to the distribution of outcomes across communities? Maybe. Does it embody sufficient attention to the disadvantaged? Likely not, and if so, only by accident.
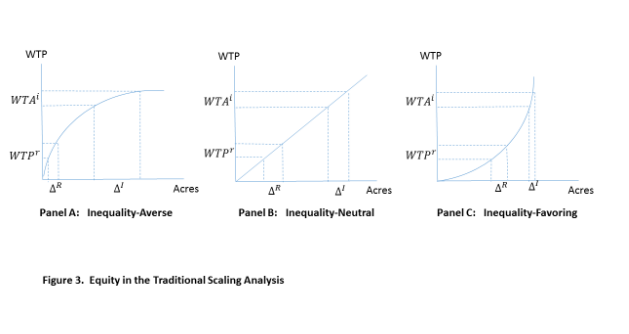
Returning to Figure 2, it is clear from the previous discussion that PC combined with CE would have the WTA polygon in Panel A equal to the WTP polygon in Panel B (assuming projects are scalable). The Kaldor-Hicks approach weights equally the well-being of the members of the two communities. What this means for changes in park acreage (and trips) depends on how the change in WTP varies with the baseline number of acres. Three cases are shown in Figure 3.13 In this figure, the change in WTP and WTA are the same across panels, but the associated change in acres varies widely. The figure assumes that the injured community is advantaged and the restored community is disadvantaged, but this need not be the case.
13 For example, empirical models of the demand for recreation at a single site include the Poisson count data model where 𝑢(𝑇) is linear and a Tobit model where 𝑢(𝑇) is convex rather than concave. If trips are proportional to acres, then these properties will carry over to the relationship between WTP and acres.
If the demand curve for trips exhibits WTP neutrality, WTP plots linearly with acreage, as in Panel B of Figure 3. Equating WTA and WTP implies that each community gets the same change in park acreage and the same change in trips 14 Neutrality also implies that the mean number of parks is the same no matter where the project is located. Satisfying PC creates a balanced transfer in this case. Effects on inequality are ambiguous. If N is invoked, then the distribution is unchanged; if community 𝑟 is relatively disadvantaged compared to community 𝑖, then inequality is reduced, and vice versa. Again, if the siting is based on CE, a conflict between CE and EJ can arise.
If the recreation demand analysis results in a curved relationship between acres and WTP, then there is a divergence between changes in acres and changes in WTP. The transfers involved are unbalanced. In Panel A, there is aversion to inequality; placing the restoration in a relatively disadvantaged (resp. advantaged) community increases (resp. decreases) the social value per unit of acreage, and hence fewer (resp. more) acres of restoration are need to generate the same uplift in WTP. The opposite conclusions are true in Panel C, where the demand curve leads to an inequality-favoring relationship between acres and WTP.
In general, little can be said about the exact effects without a numerical model. But it is certainly the case that caring deeply about inequality and invoking PC can lead to making the distribution of park acreages more unequal, even while the social welfare changes are balanced, and that favoring inequality and invoking PC can make the distribution of parks more equal.
It is noteworthy that these are all unintended consequences of the traditional analysis because no attention is directed explicitly to the issues.
Also, recall that I have assumed that money incomes are the same in every community, so the analysis above is relative richness or poorness in recreation site acreage. An additional reason the traditional analysis may fail to adequately address justice is that those with low money incomes will be WTP less and those with high incomes WTP more for the same change in acreage starting from the same baseline. If this is true, the simple summation is skewed toward giving priority to those with more income.
Social Value-to-Social Value Scaling
Approaches to environmental justice other than that adopted here may alter one or more of these specifications. The approach is consequentialist, welfarist, and separable, and it assumes self-interested individual preferences, revealed by informed choice of trips. These are consistent with my goal of minimally changing current methods.
The SVtoSV method has the same two steps as the traditional approach, namely measurement of individual well-being and aggregation over people. The Kaldor-Hicks aggregation in the second step of the traditional approach was developed to support decision-making without needing comparisons of well-being across people. The SVtoSV approach to aggregation sets aside Kaldor-Hicks and requires interpersonal comparisons of well-being. Therefore, the measurement of individual
14 This is consistent with a “trip equivalency analysis”; see MacNair et al. (2022) for a development of trip equivalency.
well-being in the first step may need to be modified to admit such comparisons.15
Interpersonal Comparisons via Equivalent Incomes
In the traditional approach to measuring individual well-being, each community’s net WTP (the triangle area
shown in Figure 1) is defined relative to that community’s baseline price. In the modified analysis, all communities measure their baseline level of well-being from the same common price. With this alteration, the resulting measure is called “equivalent income.”16 The reference price is arbitrary; it is common to base it on either the most advantageous or the most disadvantaged situation.
Equivalent income is defined as the amount of income needed to achieve the baseline level of well-being when non-income determinants of well-being (here, recreation opportunities) are set to an arbitrary reference level. Suppose that the most disadvantaged community regarding recreation site acreage is chosen as the reference condition, and hence that common reference price is the highest price. It then must be that equivalent income is more than actual income. If advantaged community 𝑎 faced the higher reference price 𝑝d instead of the relatively low price 𝑝a actually prevailing, income in community 𝑛 must be raised for it to be indifferent between the two circumstances. The difference between actual and equivalent income is the amount that an advantaged community “feels richer” than a disadvantaged community by virtue of having better access to recreation sites. The difference between actual income and equivalent income in a community is the WTP to avoid being forced to walk (to the recreation site) in the shoes of the most disadvantaged community rather than in the privileged shoes the community gets to wear at baseline.
Equivalent income is an index of the level of well-being achieved in a given community.17 The environmental justice approach is to aggregate equivalent income across communities into an index of overall social wellbeing. This latter may be a complex function of community well-being measures, not necessarily a simple summation. In this instance, one cannot calculate the changes in equivalent income but instead must calculate the difference in social welfare at baseline and with the injury and restoration.
Calculating equivalent income does not require any more data than the calculation of WTP/WTA in the traditional approach, other than an understanding of the distribution of recreation site acreages across communities.
15 The basic approach adopted in this section is set forth by Laffont (1988).
16 The Kaldor-Hicks test was developed to allow a decision to be made in the aggregate even though individual well-being levels or differences are assumed not comparable. The environmental justice analysis requires they be comparable. In order to do this, the equivalent income approach can be used. An alternative approach is to use preferences over gambles following Harsanyi (1955); Adler (2019) provides a detailed introduction.
17 It is a utility function—that is, a numbering system for sets of indifferent consumption bundles.
The equivalent income approach is not needed in my very simple model where people have the same preferences and income; the only dimension of inequality is park acreage. An only slightly more elaborate model would require it, and so I include the step here.
Social Welfare Functions
As discussed above, there is a potential tradeoff to be made between equity and efficiency when choosing restoration in NRDA. Let 𝑄B be the baseline distribution of recreation site acres across communities; this is a list of acres in the communities in order of increasing acres. Let the baseline distribution have a mean (or average) acreage of recreation sites equal to 𝜇(𝑄B). After the injury, the distribution becomes 𝑄𝐼, which deducts physical injury ∆𝑖𝐼 from community 𝑖’s baseline acreage. The new mean is 𝜇(𝑄𝐼), which is less than the mean at baseline. The restoration project, which adds acreage ∆R𝑟 to community 𝑟, results in a restored distribution 𝑄R with its mean 𝜇(𝑄R).
The mean is related to the issue of efficiency. If the restoration is inefficiently located, the cost differential between that location and the location with the lowest cost could be spent on more recreation sites for all, as described above. This would raise the mean amount of recreation sites above what it would be with the inefficient siting of restoration. But as noted, this may come with an increase in inequality. A computational way to make these tradeoffs is needed.
Social Welfare and Inequality
I make use of an index of social welfare, called a social welfare function (SWF), to assess potential tradeoffs between equity and efficiency in restoration decision-making.18 Suppose the equivalent income index of wellbeing achieved in any community 𝑛 is 𝑀nE, measured as described in the previous section. Let 𝑀E be the entire distribution of well-being levels across all the communities. The average amount of well-being is 𝜇(𝑀E). Let 𝐼(𝑀E) be some sensible measure of the amount of inequality in well-being across communities (with larger 𝐼 implying more inequality).19 A conceptual social welfare index would be of the form 𝑊(𝜇(𝑀E),𝐼(𝑀E)). A larger mean increases welfare and a larger amount of inequality reduces it. Instead of aggregate WTP, scaling is done in terms of the measure 𝑊. Given my model, inequality in the distribution of equivalent income is derived from inequality in prices, derived in turn from inequality in acreages of recreation sites.
A useful version of this is
𝑊(𝜇(𝑀E),𝐼(𝑀E)) = 𝜇(𝑀E)[1− 𝐼(𝑀E)] . (1)
Turning to the inequality index, it can be asked what equal distribution of equivalent income would give the same welfare as an unequal distribution. This equal distribution 𝑚 is defined by the condition
𝑊(𝑀E) = 𝑊(𝑚, 𝑚, … 𝑚), (2)
18 This section based on the exposition in Cowell (2016).
19 See Cowell (2016) for an overview of approaches for measuring inequality in a single dimension
where the right-hand side of Equation 2 is the social welfare when each community has the same well-being index 𝑚. Here, 𝑚 has the interpretation of the amount of equivalent income, which, if realized equally in each community, yields the same level of social welfare as the given unequal distribution of equivalent income to which it corresponds in Equation 2. Equation 2 says that the amount of equivalent income can be used as a measure of social welfare. Of course, the level of 𝑚 depends on the distribution 𝑀E; the greater the inequality in the distribution of recreation sites and hence well-being, the worse off is society, and the lower is the equivalent equal distribution of recreation sites.
If the distribution 𝑀E exhibits inequality of well-being and society is averse to such inequality, then it must be that for social welfare to be the same, the equal distribution of equivalent income is less than the mean of the unequal distribution
𝜇(𝑀E) < 𝑚(𝑀E) . (3)
A welfare-relevant index of the amount of inequality is
𝐼(𝑀E) = 1 −𝑚(𝑀E)/𝜇(𝑀E). (4)
If recreation sites (and therefore well-being) are equally distributed across communities, then 𝐼(𝑀E) = 0 and all we care about is the mean. This is equivalent to saying that all we care about is the total, and we are back to the traditional analysis.
Using the inequality measure in Equation 4 in Equation 1, we have
𝑊(𝑀E) = 𝜇(𝑀E)[1 − 𝐼(𝑀E)] . (5)
What remains is to develop an appropriate inequality measure.
A Particular Inequality Index and Social Welfare Function
The SWF is taken to be additive in measures of social well-being assigned to levels of equivalent income. That
is,
𝑊(𝑀E) = ∑N𝑛=1 𝑤(𝑀nE). (6)
Here, the function 𝑤(𝑀nE) is a social well-being evaluation function. It is the same for all communities, and social aversion to inequality is embodied in it. Aversion to inequality comes from specifying that 𝑤(𝑀𝑀nE) is increasing (graphically, the slope is positive) but at a decreasing rate, so exhibits strict concavity (graphically, the slope decreases with more recreation sites). The SWF then puts more weight on a loss or gain in recreation sites in resource-poor communities than in resource-rich ones. This is the inequality-averse shape in Figure 2, Panel A, but with 𝑤(𝑀nE) instead of 𝑊𝑇𝑃(Qn). The increase in social welfare from a small increase in recreation site acreage is greater when the base acreage is low than when it is high.
I make the simplifying assumption that the degree of inequality aversion (the curvature in the function 𝑤(𝑀nE)) is the same all along the curve. Let the parameter 𝜀 reflect society’s aversion to inequality; a larger value is associated with a greater aversion to inequality by virtue of the function 𝑤(𝑀nE) having greater curvature.20
To apply this to the scenario posed in the NRDA parable, injury decreases the acreage of recreation sites in community 𝑖 from QiB to QiB − ∆𝑖𝐼. Of course, the injury makes that community resource poorer than at baseline
and is reflected by the increase in price there and the associated decrease in equivalent income. Suppose that
based on environmental justice considerations, the trustees choose to place restoration in community 𝑟, raising recreation site acreage from QrB to QrB + ∆𝑖𝐼, lowering the price, and increasing equivalent income. It is assumed that 𝑟 is disadvantaged at baseline in comparison to 𝑖 and further that the restored community remains worse off after the restoration than the injured community was during the period of injury (the transfer doesn’t switch the ordering of the communities). The issue, conditional on the siting of restoration in community 𝑟, is to determine the scale of restoration that leaves social well-being, as measured by the SWF, undiminished.
The result is shown in Figure 4.
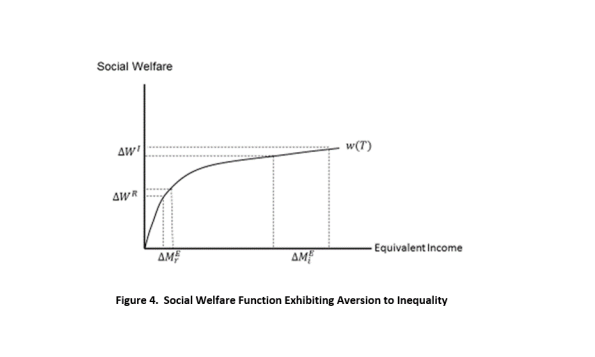
Figure 4 depicts that the injury to recreation sites causes a reduction in well-being in community 𝑖 measured
as a change in equivalent income. The SWF assigns the number 𝑤(𝑀𝐸) to well-being community 𝑖 and the
20 Suppose it has the same rate of decline in the slope of the curve everywhere along it. This functional form is called “iso-elastic” and is written as (𝑀) = 𝑀1−𝜀−1/1−𝜀
.
resulting loss in social welfare is the amount ∆. To compensate for this loss in social well-being, restoration needs to increase social welfare by this same amount. By conducting restoration in the relatively disadvantaged community 𝑟, a smaller change in equivalent income is needed, as a greater weight is attached to each increment to the community 𝑟’s well-being (equivalent income) by virtue of society’s aversion to inequality. In this sense, the SWF prioritizes the interests of the relatively poor.
Thus, relative to the case where environmental justice considerations are not included in the scaling analysis (and restoration is sited in the same community, 𝑟), the scale of restoration is smaller and the NRDs lower when environmental justice is included formally in scaling. This is because doing restoration in a more disadvantaged location is more socially beneficial—this extra benefit per acre of restoration means that fewer acres need to be restored. Restoration credits are adjusted upward to reflect this fact.
A specific form of the SWF can be specified. If the SWF is given by Equation 6, the equal equivalent income in Equation 2 is computed by the generalized average

The associated inequality measure 𝐼(𝑀𝐸) takes the index form
![]()
where 𝜇(𝑀𝐸) is the mean of the distribution of equivalent income. The inequality measure in Equation 8 is known as the Atkinson index (Atkinson 1970).
A larger 𝜀 reflects an increase in aversion to inequality and hence the strength of the commitment to environmental justice. Assume that the injury and restoration are small, and that under baseline conditions, community 𝑟 has 𝑥 times the equivalent income of community 𝑖. Suppose that the injury ∆𝐼 causes a $1 loss of equivalent income in 𝑖. Under traditional VtoV scaling, restoration ∆𝑅 takes place in 𝑟 such that it creates $1 in equivalent income. With the environmental justice perspective, this $1 gain in 𝑟 is worth 𝑡 𝜀 as much social wellbeing as the injury.21 In other words, in SVtoSV scaling each unit of restoration credit offsets 𝑡𝜀 units of injury debit when restoration takes place in a community that is 𝑡 times as rich in recreation resources (as measured by equivalent income).
There is some empirical evidence for the value of 𝜀. Groom and Maddison (2018) cite values from 1.3 to 1.6, and their meta-analysis estimates range from 1.53 to 1.55 depending on specifications, with 95 percent confidence intervals of 1.44 to 1.61 and 1.36 to 1.83, respectively. Suppose that 𝑡 = 3 and 𝜀 = 1.5. Then the rate of trade between credits and debits is about 5.2:1. The traditional analysis would undercount benefits by about 80 percent.22
21 See Cowell (2016).
22 Venmans and Groom (2021) report a value of 𝜀 = 2.9; in this case, with 𝑡 = 3 the rate of trade of credits to debits is 24.2:1.
There are two ways to interpret this. Recall the earlier discussion of efficiency. Doing restoration in a community where restoration is more costly needs justification, as without one there is a loss of efficiency—everyone could be made better off. How much of an increase in cost is society willing to bear to achieve a more just outcome? The answer in the posited scenario is 4.2 times the dollar value of the injury. Society could 1) make community 𝑖 whole by giving it $1 in equivalent income, and 2) have $4.2 of equivalent income value left to cover increases in restoration costs and still break even in social welfare terms. Of course, this is not really a consideration in NRDA, where costs are born by the responsible party and not part of scaling calculations.
Suppose instead that restoration costs are either the same in the two communities or ignored in scaling as is common in NRDAs. Then the trustees need to create recreation sites at a scale that creates $1⁄5.2 = $0.19 of increased equivalent income in community 𝑟 in order to ensure compensation of social well-being.
Socially Optimal Restoration
So far, the community in which restoration is located has been taken as given. A reasonable approach to making this a choice would be to find the combination of community and scale that minimizes the costs of restoration, subject to a constraint that social welfare as calculated in Equation 7 is at least as large as it would be at baseline.
Discussion
In this paper, I set forth one approach to including environmental justice in the estimation of NRDs for recreation. I attempted to depart minimally from current standard practices for scaling restoration using economic VtoV methods. In doing this, I maintained traditional assumptions that the public’s observed recreation behavior (trips taken to recreation sites) can be used to reveal the economic value of recreation. If the choices made reflect self-interested behavior, as they probably do, then these choices cannot reveal the public’s preferences regarding how public recreation resources should be distributed across members of the public under baseline conditions. It may well be that the public feels that this distribution should exhibit a degree of fairness, but this would not appear in the individual recreation choices made given some actual array of recreation sites across space.
In the standard model, individual well-being functions (utility functions) are specified and estimated. From these, WTP and WTA measures are calculated that are dollar-denominated indices of changes in individual well-being brought about by injury to and restoration of public recreation resources. Simple addition of the welfare measures leads to scaling of restoration such that some people are better off and some worse off. While the scale can be efficient, it need not be fair. This depends on the shape of the estimated individual utility functions. If the individual utility functions are curved as in Figure 2, then each person has an aversion to inequality in their personal access to recreation. They would pay more for a unit of recreation if they are currently resource poor than if they are resource rich. Hence, the simple aggregation looks just like that in Equation 8 with the social well-being function 𝑤(𝑀𝑛𝐸) replaced by individual utility functions 𝑢(𝑄𝑛). For future reference, let 𝜃 denote the (fixed) curvature of individual utility functions. The traditional analysis therefore embodies a concern for equity governed by the size of 𝜃.
A question arises as to whether any extra consideration needs to be given to environmental justice issues by the natural resource trustees. Suppose that both individual curvature in utility (governed by 𝜃) and social aversion to inequality (governed by 𝜀) are included in the SWF. The range of values from Groom and Maddison (2018) cited above may be more indicative of the individual parameter 𝜃 than a social (trustee) parameter 𝜀. This would be less true of estimates using progressivity of tax schedules, which explicitly embody social considerations.
There are several reasons why using both parameters may be in order. First, if the individual utility functions are linear (Figure 2 is a straight line), then individual utility exhibits no inequality aversion (𝜃 = 0) and all such aversion must derive from the parameter 𝜀 in the SWF. Second, in my simple model, the only source of inequity is recreation site acreage. If money income were also distributed unequally across communities, then the WTP for recreation site acreage of relatively income-poor communities would be lower than that of income-rich communities, even if they have the same recreation site acreage. In this case, the standard approach embodies an underlying priority for the well-being of the rich, which may or may not be overcome by 𝜃 (and surely would not be if 𝜃 = 0). This is a potentially perverse outcome from the standpoint of ethics. Third, as discussed earlier, the estimated utility functions are derived from recreation trips, not a holistic assessment of the distribution of all there is to be distributed that is ethically meaningful. Therefore, the trustees may wish to expand on the views derived from the individual recreation functions.
This discussion begs the question of what information the trustees should rely on to set the parameter 𝜀. One answer is that they can vary the parameter as a sensitivity analysis and see the effect on restoration scaling and NRD estimates. But at some point, a decision must be made. A second is that they should base their analysis on individual preferences for inequality, expressed as a person’s aversion to inequality in one’s own trips. Of course, this takes the analysis back to using the individual parameter 𝜃, estimated using the recreational trip data and therefore baked into the demand curve. This is the traditional analysis. Empirical information on this currently is scanty. Finally, they could look for outside evidence from broader circumstances, in which case something on the order of 𝜀 = 1.5 is indicated.
In my model of NRDA, the SWF is a partial one, considering only the dimensions of income and access to recreation. Thus, it ignores other potential sources of injustice, such as other availability of other environmental services, health and income, and generally all that leads to living a fulfilled life. While there certainly would seem to be an ethical basis for such broader considerations, this certainly makes the analysis more informationally demanding, and the issue of multidimensional equality measures and SWFs is far from settled (e.g., Chakravarty 2018).
References
Adler, M. 2019. Measuring Social Welfare: An Introduction. Oxford University Press, New York, NY
Adler, M., and M. Fleurbaey (eds). 2016. The Oxford Handbook and Well-Being and Public Policy. Oxford University Press, New York, NY.
Atkinson, A.B. 1970. On the measurement of inequality. Journal of Economic Theory 2(3):244–263
Bockstael, N., and K. McConnell. 2007. Environmental and Resource Valuation with Revealed Preferences: A Theoretical Guide to Empirical Models. Springer. Dordrecht, The Netherlands.
Brown, G. 1993. Economics of natural resource damage assessment: A critique. In: Valuing Natural Assets: The Economics of Natural Resource Damage Assessment. R. Kopp and V.K. Smith (eds). Resources for the Future, Washington, DC.
Byrd, H., and T. Tomasi. 2021. Damages to recreation from an oil spill: Why current assessments typically are wrong and what can be done to fix them. In: Proc. of the International Oil Spill Conference. Vol. 2021:Forthcoming.
Chakravarty, S. 2018. Analyzing Multidimensional Well-Being: A Quantitative Approach. John Wiley & Sons, Hoboken, NJ.
Cowell, F. 2016. Inequality and poverty measures. In: The Oxford Handbook and Well-Being and Public Policy. M. Adler and M. Fleurbaey (eds). Oxford University Press, New York, NY.
Groom, B., and D. Maddison. 2018. New estimates of the elasticity of marginal utility in the UK. Environmental and Resource Economics 72:1155–1182.
Harsanyi, J. 1955. Cardinal welfare, individualistic ethics, and interpersonal comparisons of utility. Journal of Political Economy 63:309–321.
Laffont, J-J. 1988. Fundamentals of Public Economics. Revised English-language edition, translated by J. Bonin and H. Bonin. The MIT Press, Cambridge, MA.
MacNair, D., G. Parsons, T. Tomasi, and H. Byrd. 2022. Trip equivalency for economic valuation in recreation demand models: Implications for compensatory restoration and benefits transfer. Marine Resource Economics 37:1-17.
Parsons, G.R., and A.K. Kang. 2010. Compensatory restoration in a random utility model of recreation demand. Contemporary Economic Policy 28(4):453–463.
Venmans, F., and B. Groom. 2021. Social discounting, inequality aversion and the environment. Journal of Environmental Economics and Management 109:102479.
Viscusi, W.K. 2001. Risk equity. In: Cost-Benefit Analysis: Legal, Economic and Philosophical Perspectives. M. Adler and E. Posner (eds). University of Chicago Press, Chicago, IL.
Published
December 15, 2021

About the Author
Dr. Ted Tomasi has more than 40 years of experience as a natural resource economist, specializing in the valuation of... Full bio