Select Page
Jennifer Pettis Schallert
Senior Consultant

Jennifer Pettis Schallert

Senior Consultant

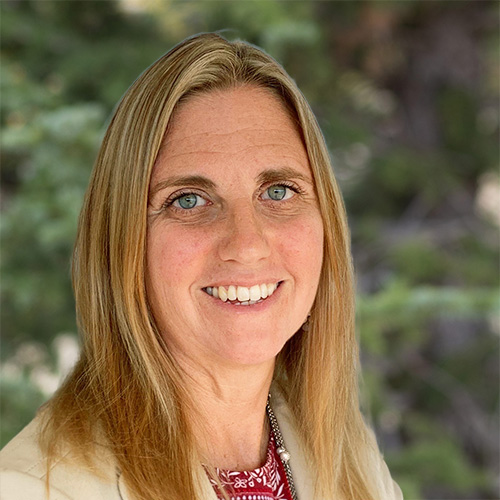
Ms. Jennifer Pettis Schallert is a data analyst with more than 20 years of experience answering complex questions with data-driven solutions.  Her scientific background spans various areas of biology and environmental science, including fisheries biology, acoustics, sediment studies, ecology, marine mammals, and clinical research.  Creating analytical tools in these diverse areas with stringent regulatory oversight has honed her ability to provide clear solutions that facilitate communication and decision-making among stakeholders, scientists, and regulators alike.  Her foremost passion is to find ways to make complicated data transparent and easily communicated.

Ms. Pettis Scha...

Ms. Jennifer Pettis Schallert is a data analyst with more than 20 years of experience answering complex questions with data-driven solutions.  Her scientific background spans various areas of biology and environmental science, including fisheries biology, acoustics, sediment studies, ecology, marine mammals, and clinical research.  Creating analytical tools in these diverse areas with stringent regulatory oversight has honed her ability to provide clear solutions that facilitate communication and decision-making among stakeholders, scientists, and regulators alike.  Her foremost passion is to find ways to make complicated data transparent and easily communicated.

Ms. Pettis Schallert can advise on study design, data collection, and analytical methods based on the question of interest; complete analyses; and build analytical and visualization tools leveraging a variety of solutions. These tools may range from simple scripts that automate repetitive data tasks to a package of functions to perform complicated statistical models and analyses. In addition, she is adept at putting these backend solutions into dashboards to allow stakeholders user-friendly and interactive data visualizations. Her technological experience includes R, MATLAB, Shiny, Python, SAS, IDL, and LaTeX. Because she works in regulated environments, Ms. Pettis Schallert has a strong understanding of how regulatory and resource agencies interact during regulatory and permitting processes. She has had firsthand experience working with EPA, FDA, U.S. Army Corps of Engineers, NOAA Fisheries, U.S. Fish and Wildlife Service, and Regional Water Quality Control Boards.


Read More    Read Less   

Data Analysis

Dashboard Creation for a High-Resolution, Optically Based, Chemical Contaminant Monitoring System for Remedy Performance Evaluation at DOD Contaminated Sediment Sites, Pearl Harbor, Hawai‘i Programmed with a team to create a robust, user-friendly Shiny dashboard to upload and visualize standardized data both geographically and on time-series plots. Dashboard has user options available to filter data and customize plots to adjust model parameters based on visualizations to help identify outliers. Data with the outliers removed are then used to complete the statistical analysis and the output is displayed in results visualizations. Used RShiny, MATLAB, and some Python, along with statistical modeling.
Automation of Annual and Monthly Reporting Requirements under NPDES Permits for a Wastewater Discharger, San Diego, California Led a team of eight marine biologists and participated technically in the generation of a set of scripts to interact directly with a 20-year-long Oracle 10g database to access oceanographic, water quality, benthic, sediment, and fish trawl data. Scripts were created to perform QA/QC of the data, load data, extract data, and create visualizations, tables, and reports to be submitted to regulatory agencies. This work was completed using R, Python, SAS, SQL, MATLAB, and LaTeX. While the workflow was greatly streamlined from its predecessor, it was left open and a formal dashboard was not created to allow analysts easier access for continual improvement and to make changes to visualizations as dictated by recently collected data.
Sediment Chemistry Spatial Data Analysis, San Diego, California Working with a sediment scientist, led data analysis method development for an understanding of long-term sediment chemistry data in relation to a wastewater effluent plume. Chose kriging as the statistical method to create geographic surfaces in R and map sediment chemistry in relation to the wastewater outfall plume. Created analysis shape layers in R and exported the layers to shape files for import into ArcGIS.
Wastewater Plume Spatial Analysis, San Diego, California Used existing methodology developed by Scripps Institution of Oceanography in MATLAB to adapt empirical orthogonal functions (EOF) analysis for wastewater effluent plume monitoring to determine seasonal predominant plume effluent directions. Initial work was done in MATLAB and eventually translated to R. Created data visualizations to show predominant and less dominant current directions using the EOF.
Contaminant Fate and Transport Models, Onondaga Lake, New York Programmed and analyzed data to understand contaminant fate and transport along with potentially responsible parties at Onondaga Lake site. Modeling was done in IDL, and mapping and data visualization were performed in ArcGIS.
Movement of Salmon in Relation to Dredging Projects, San Francisco Bay, California Led programming efforts to track and map acoustically-tagged salmon to facilitate salmon scientist’s knowledge about salmon movements and efforts to avoid impacts from dredging activities in San Francisco Bay.  Statistical analyses and data visualizations were completed in MATLAB.
Marine Mammal Signal Data Visualization and Analysis GUI (Signal Detective) Developed and implemented Shiny application to retrieve acoustic clips from a user-defined directory, display spectrograms, categorize signals by species, and record data in a standardized format. The graphical user interface (GUI) allows users to play signals along with adjusting and filtering spectrogram settings in order to allow for optimal signal viewing conditions and species identification.  This work was completed using RShiny.
Dolphin Communication Project Developed and managed a set of visualization and analytical tools in R and Shiny. One application (WhistleGen) was created to generate artificial dolphin whistles based on several user inputs, including signal duration, amplitude, frequencies, and number of specified points. In addition to this, a Shiny GUI was created to interact with acoustic recordings as they populate a directory, display spectrograms, allow a user to accept or delete a recording, and collect user-entered data in a standardized format. This work was completed in RShiny.
Adaptation of DeepSqueak GUI DeepSqueak, an open-source MATLAB package used to detect and classify mouse and rat signals, was determined to have components that could be very useful for dolphin whistle detection and classification.  This study used DeepSqueak to train a neural network specialized for dolphin whistle detection. In addition, backend edits in DeepSqueak were created to evaluate the quality of clustering and determine the ideal value for number of clustering in the k-means clustering methods. These included silhouette analyses and t-SNE. Further, the work on this program involved creating higher resolutions sampling of whistles than the original code to gather more data for the k-means cluster analysis.  Finally, a principal components analysis was used to determine which metrics of dolphin whistles should be used for cluster analyses. Several methodologies were explored for whistle classification, including variational autoencoder, and k-means was determined to be the most robust.
Internal Lead for Data Analysis and Programming Standards, San Diego, California Established standards for coding, QA/QC protocols, and an analytical programming working group. Led the QA/QC group and facilitated the analytical programming working group as open forum to discuss data analyses, visualizations, results, and analytical methodology along with facilitating an open community to provide help to analysts as needed. Also, led several training sessions ranging from introductory through advanced R programming and special topics including data visualizations and spatial analyses.
Dashboard to Evaluate the Safety and Efficacy of a Study Molecule in the Treatment of Lung Cancer in Ongoing Clinical Trials, California Led data science efforts to create user-interactive visualizations and data displays to evaluate the safety of study drugs, including monitoring type, frequency, and duration of adverse events along with their outcomes. In addition to safety, efficacy is also monitored by the study team to determine outcomes of patients with study treatment. This dashboard was created through feedback from a team of doctors and scientists to monitor studies. Development of this dashboard required the use of Spotfire and R.
Data Analysis to Create Visualizations of Safety Indicators for a Study Molecule in the Treatment of Various Oncology Indications, California Led data science efforts working alongside the study physician to create visualizations to evaluate time to onset of various adverse events along with adverse event duration by molecule across clinical research studies. This project required the use of R and adaptive programming based upon physician feedback.
Data Squad Data Visualization, San Francisco, California Led a cross-functional team to present data science solutions to analytical questions in oncology clinical trial data. This generally included presentations by data science tool users to demonstrate how they are using tools built by the data science team to answer their data questions.
Data Preparation for Oncology Clinical Trials, Carlsbad, California Worked in a team to prepare clinical trial data for submission to FDA according to its guidelines. Work was done in SAS.
Movement Patterns and Dive Behavior of Leatherback Turtles, Monterey, California Programmed data visualizations and analyses to understand the movements and population sizes of leatherback sea turtles that were tagged with time depth recorders off the coast of Monterey, California. Used data from satellite tags to visualize individual dive profiles. Collected metrics on these dive profiles and used those metrics to categorize dive profiles by shape and relate dive behavior to leatherback turtle activities. Statistical analyses and data visualizations were completed in MATLAB.
Echosounder Effects on Transect Population Abundance Estimates in the Eastern Tropical Pacific, Pacific Ocean Collected data and programmed analyses to understand impacts to cetacean abundance estimates while the shipboard echosounder was off versus on. These data were used to provide an estimate of the impact of the ship's echosounder (attractive or detractive) to various species of marine mammals, which could bias observer views of animals and cause higher or lower estimates of abundance. Statistical analyses and data visualizations were completed using S-Plus.

Planning and Permitting

Essential Fish Habitat, Long Beach, California Completed reviews of coastal development projects for consistency with the essential fish habitat provisions under the Magnuson-Stevens Act. This included monitoring bays and estuaries as a whole system to determine impacts that could be minimized versus impacts to be mitigated.
Essential Fish Habitat Consultations, Southern California Represented several clients for dock builds and expansions in San Diego and Newport Beach. This included representation at resource agency meetings and submission of permitting documents.
Biological Assessment, Snohomish County, Washington Competed biological assessments for endangered and threatened species as a part of NEPA for various river dredging projects.

Contaminated Sediments

Sediment Sampling and Characterization, San Diego Bay, California Led a team to characterize sediments in San Diego Bay in shallow water. This required specialized equipment to be able to collect sediment samples.
Sediment Sampling and Characterization, San Francisco Bay, California Led a team to carry out a sampling and analysis plan to characterize sediments in a dredge footprint for ship traffic.

Marine Science

Wetland Delineation, Sacramento, California Completed wetland delineation and plant identification to determine sensitivity to nearby construction activities and complete the required steps for project consultation.
Shipboard Surveys for Environmental Monitoring of Wastewater Plume, San Diego, California Worked as a part of a team to collect water quality; conductivity, temperature, and depth (CTD); and benthic, sediment, and trawl data at regular intervals. Also, participated in regional discharger sampling events.
Scientific Diving, Southern California Received certification as an advanced diver, scientific diver, and NOAA diver. Conducted habitat surveys of Southern California kelp forest to determine impacts from wastewater effluent. Also, surveyed bay eelgrass habitats for health and abundance.
Eastern Tropical Pacific Line Transect Study, Eastern Tropical Pacific Observer on month-long leg of research study to estimate the abundance of cetacean species in the Eastern Tropical Pacific to determine population sizes and health. Rotated between acoustic observations and visual observations along with using acoustic recording and localization programs with a towed hydrophone array.
Aerial Line Transect Study, Baja California, Mexico Observer and part of data collection team for Cessna aerial surveys to estimate the distribution and abundance of loggerhead and green sea turtles.
Navy Sonar Ocean Observer, Glasgow, Scotland Observer and data recorder for acoustic and visual sightings of marine mammals during navy sonar testing offshore of Glasgow, Scotland.
Oil Platform Removal Observer, Gulf of Mexico, United States Observer in the oil platform removal project as a part of the Minerals Management Service program. Part of a team tasked with ensuring that no protected, endangered, or threatened species were injured during use of explosives for oil platform removal and minimizing impacts to the marine environment.
Photoidentification and Movement Patterns of Fin Whales, Gulf of California, Mexico Used photoidentification methodology to estimate population sizes of fin whales in the Gulf of California, Mexico. Led efforts in Guaymas and Bahia Kino and collaborated with other sites throughout the Gulf of California. This required fluency in Spanish.
Echolocation in Bottlenose Dolphins, Shark Bay, Western Australia Collected acoustic data to understand temporal patterning of echolocation in bottlenose dolphins and its development in three newborn calves. This required learning new skills in acoustic data collection and analysis.
RETURN TO OUR TEAM PAGE