The risk of catastrophic wildfires is increasing. Rising global temperatures, changing precipitation and wind patterns, and alterations in vegetation are contributing to environmental conditions conducive to more frequent and intense wildfires (IPCC 2022). This elevated risk poses unique and complex challenges to electric utilities, government entities, and communities as they grapple with developing comprehensive management strategies to reduce the risk of fires, ensure public health and safety, enhance economic stability, and protect natural resources and ecosystems. According to preliminary estimates from the California Department of Forestry and Fire Protection (CAL FIRE), the recent Eaton and Palisades wildfires will be the most devastating wildfires in U.S. history as measured by several criteria (CAL FIRE 2024).
Electric utilities face difficult decisions during periods of elevated wildfire risk. To protect public safety, natural resources, infrastructure, and other assets, utilities can de-energize power lines so that high winds do not ignite a fire. However, de-energizing lines may cause various negative economic outcomes for communities, including impacts on public health and safety, local employment, income, tax revenues, and home habitability.[1] This challenging situation calls for an analysis of the pros and cons of two alternative actions: 1) de-energizing the lines in high-risk locations to avoid a fire and all of its associated consequences while imposing the community costs listed above, or 2) leaving the lines energized and risk a wildfire. Which choice by a public utility will best protect public well-being?
Microgrids and distributed energy resources may provide a cost-effective solution to this challenge. A microgrid is a self-contained, localized electrical network that can operate independently or in conjunction with the primary electrical grid. Microgrids comprise distributed energy resources that can provide independent power to critical loads upon the loss of the primary source of energy. They include renewable energy sources (e.g., solar, wind, hydrokinetic, biomass), energy storage (e.g., batteries), and conventional power generators that use gasoline, diesel, or natural gas as fuel. A microgrid allows for the management of electricity supply to a specific geographic area or facility independent of the primary grid. It can provide a variety of benefits, but it also comes at a cost.
This paper focuses only on the role of microgrids in managing wildfire risks. During a period of elevated wildfire risk, a microgrid can provide a residence, community, or facility with a reliable source of energy as a general power supply component or an emergency power supply when the local grid is de-energized. Analyses can be conducted that evaluate microgrid installation and implementation for communities at high risk of wildfires. The following sections present information from the Camp, Thomas, and Witch fires in California and show how they can be used to evaluate the benefits of the construction of three hypothetical microgrids. Figure 1 presents the burn perimeters of these wildfires.
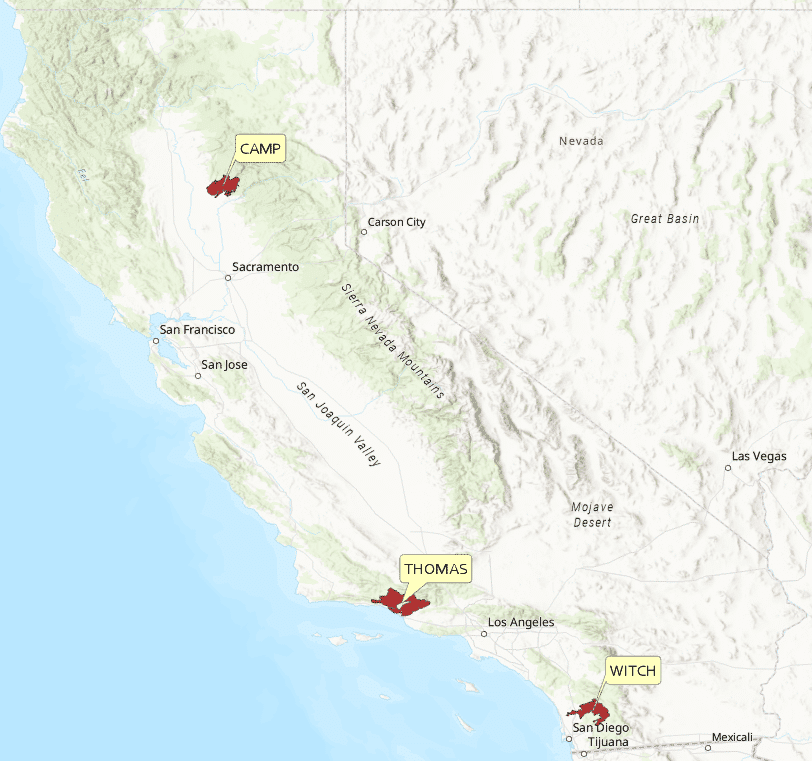
Figure 1. Case Study Wildfire Locations
We estimate expected avoided losses per year under a scenario in which a microgrid had been constructed and used during periods of elevated wildfire risk. Additionally, we use estimates of net benefits and benefit–cost ratios (BCRs) to evaluate the potential magnitudes and cost-efficiency of various microgrid alternatives. We also show that microgrid investments—even when using conservative assumptions—can be highly cost beneficial for communities fitting certain risk profiles, and we show that the preferred wildfire risk mitigation option may not necessarily be the one that protects the most valuable buildings, depending on the probabilities selected. This last conclusion has important implications regarding the fairness of responses to wildfire risks.
For some communities with dispersed populations or lower population densities, a microgrid may not be the most cost-effective approach to wildfire resilience. In such situations, household-level or highly localized incentive programs—for example, grant programs to support investments in household-level battery power—may be more cost effective. The choice of approach is highly dependent on the wildfire risk profile of the community under evaluation.
Microgrid Overview
The U.S. Department of Energy defines microgrids as follows (Ton and Smith 2012):
[A microgrid is] a group of interconnected loads and distributed energy resources within clearly defined electrical boundaries that acts as a single controllable entity with respect to the grid. A microgrid can connect and disconnect from the grid to enable it to operate in both grid-connected or island-mode.
Microgrids are composed of distributed energy resources that can provide independent power to critical loads upon the loss of the primary source of energy.
Microgrids fall into several categories, including campus or institutional, commercial and industrial, and community categories, among others. A representative example of a microgrid is found at Blue Lake Rancheria in Humboldt County, California. Blue Lake Rancheria is a remote community approximately 300 miles north of San Francisco, California, and is a federally recognized tribe. The microgrid there provides energy resilience to the community, incorporates renewable energy, and provides approximately $150,000 in annual electricity savings (Carter et al. 2019). Microgrids are also used in suburban contexts; for example, a development in Menifee, California, is a 200-residence microgrid community that can fully power itself during an outage of the main grid (Griffo 2022).
One of the main benefits of microgrid installation is the ability for a community to operate as a self-sustaining unit separate from the main energy grid. Therefore, communities in high-risk wildfire areas could be protected from wildfires by de-energizing the power lines in wildland areas during high-wind events. However, in typical grid situations, power companies responsible for de-energizing lines face adverse consequences of doing so because the structure of the grid would mean that they would disconnect power to many customers who may not be at risk of wildfire. These customers face all the negative aspects of disconnected power (e.g., loss of internet connectivity, refrigeration, and hot water) and none of the benefits of foregone losses due to wildfire damage. Michael Wara, the director of the Climate and Energy Policy program at Stanford University, estimated that a 48-hour outage to 800,000 customers in October 2019 cost around $2.5 billion (Koran 2019).
A study by the National Renewable Energy Laboratory (NREL) found that a majority of new community microgrids cost between $1.4 million and $3.3 million per megawatt to construct, with an average of around $2 million per megawatt (Giraldez et al. 2018). New microgrids include costs that can be classified into four general categories: new energy generation (conventional and renewable), controller costs, soft costs, and additional infrastructure costs.
Figure 2 presents a breakdown of component costs for a new community microgrid.

Figure 2. Average Cost per Megawatt by Component (Giraldez et al. 2018)
The Blue Lake Rancheria microgrid project, for example, was a community microgrid with a 420-kW capacity of solar photovoltaic generation along with 500 kW of battery storage[2] for a total project cost of $6.3 million (in 2018 dollars) (Carter et al. 2019). The components of that microgrid include a new solar electric system, battery energy storage system, microgrid management system, protective relay, energy management system (for building control integration), distribution system infrastructure (purchased from PG&E), and new point of common coupling.
Benefit–Cost Analysis
This section summarizes a simplified benefit–cost analysis of the hypothetical implementation of microgrids for the Camp, Thomas, and Witch historical wildfires. We selected these fires because they have publicly available data describing insured losses from a single data source.
One challenge of this analysis regards the comparability of data describing wildfire impact estimates. In some cases, the publicly available impact estimates include not only direct impacts, such as residential and commercial structure losses, but also secondary impacts, such as health effects or indirect economic losses. In other cases, the impact estimates may exclude health effects, but include other impact elements, such as fire suppression costs. The inconsistent inclusion and exclusion of certain cost elements renders the impact estimates incomparable. Insured losses, however, provide a comparable basis for the benefit–cost analysis.
Conceptual Model and Approach
The analysis estimates the incremental costs and benefits of hypothetical microgrids had they existed prior to the historical wildfire events. This approach allows us to assess realized costs and damages from historical wildfire events compared to potential costs and damages from a hypothetical event, the extent and duration of which are uncertain. In other words, it postulates what losses would have been avoided had the microgrid existed and been operational when the event occurred. We estimate the costs from the actual wildfire events and assume that, from an ex ante perspective, the probabilities of these fires occurring and becoming significant are equal.[3] Next, we compare the costs of keeping the lines energized and experiencing the fire against the community impacts of de-energizing the lines with the microgrid in operation, thus avoiding the wildfire.
This analysis focuses on the estimation of the discounted net benefits, payoff periods, and BCRs of hypothetical microgrid projects.[4] The discounted net benefits are the difference between the cumulative discounted total benefits and the cumulative discounted total costs. A positive discounted net benefit indicates that the microgrid is cost beneficial and will pay for itself over time. It also summarizes the overall magnitude of the microgrid option in dollar terms. We also evaluate the payoff periods for the hypothetical microgrids, which serve as a proxy for a longitudinal cost-effectiveness metric. We estimate the payoff period by identifying the point in time after construction of the microgrid at which the cumulative discounted benefits meet or exceed the cumulative discounted costs. The faster the payoff period, the more cost-effective and advantageous the microgrid. Finally, we calculate the BCR of each microgrid, which is the ratio of the cumulative discounted benefits divided by the cumulative discounted costs. The higher the BCR, the higher the cost effectiveness of the mitigation option. Both the payoff period and the BCR can then be used by decision-makers as they grapple with the complex challenge of distributing limited resilience funding and resources.
The analysis accounts for life cycle costs, including one-time and recurring costs over the project’s lifetime. Life cycle costs include costs for land acquisition, construction (including soft costs, additional infrastructure, renewable generation, conventional generation, energy storage, and controls), operations, and maintenance. The analysis also captures private and social benefits. In this context, benefits are represented by avoided impacts because the hypothetical microgrid would have been in place and operational. Private benefits include avoided commercial, residential, and vehicular losses. Social benefits include avoided health impacts, deaths, indirect economic losses, and costs of fire suppression. For brevity and simplicity, we exclude some important and potentially large impacts, such as avoided environmental damages. We discuss these impacts in the Discussion section of this paper.
Avoided Costs (Benefits)
Consistent and comparable data across wildfires are limited. Thus, we use insured loss information—which is available for all three wildfires from a single data source—as a proxy for direct capital losses. We then estimate the health costs and indirect economic losses using values from Wang et al. (2021) as scaling factors. Additionally, we include the monetized impacts of deaths using the value of a statistical life parameter of $11.3 million (in 2021 dollars) from the U.S. Environmental Protection Agency as a monetization factor (88 Fed. Reg. 17826). Finally, we include the costs of fire suppression, which we compiled from CAL FIRE (2020–2022), the National Interagency Fire Center (2018), and Maranghides and Mell (2011).
Table 1 summarizes the insured losses of the historical wildfire events.
| Table 1. Wildfire Impacts as Insured Losses | |
| Fire | Insured Losses
(millions, 2024 dollars) |
| Camp Fire | $12,444.8 |
| Thomas Fire | $2,859.4 |
| Witch Fire | $2,407.9 |
Source: III (2023)
Table 2 presents the estimated monetized impacts due to health impacts, indirect economic losses, fire suppression, and deaths.
| Table 2. Wildfire Impacts besides Insured Losses | ||||
| Fire | Health Impacts | Indirect Economic Losses | Fire Suppression | Deaths |
| Camp Fire | $14,409.7 | $38,644.3 | $187.4 | $1,111.9 |
| Thomas Fire | $3,310.9 | $8,879.2 | $294.3 | $26.2 |
| Witch Fire | $2,788.1 | $7,477.2 | $27.2 | $26.2 |
Note: All values are reported as millions of 2024 dollars.
Sources: CAL FIRE (2020–2022), National Interagency Fire Center (2018), Maranghides and Mell (2011), and Wang et al. (2021).
Costs
We estimate the following components of microgrid costs for the benefit–cost analysis:
- Land acquisition
- Construction (including soft costs, additional infrastructure, renewable generation, conventional generation, energy storage, and controls)
- Operations
- Maintenance.
We first estimate the capacity size required of the microgrids relative to the populations served. A higher capacity indicates the ability of a microgrid to handle a higher peak demand of its customers. We estimate the population to be served using the population density found in buffers of various distances around the ignition points of the wildfires, and we identify these populations using the latitudes and longitudes of the ignition points from Short (2022) and population densities by census tract for 2020 from the U.S. Census Bureau (2024). We then calculate the percentage of each tract captured within our specified buffer to determine a weighted average density for the buffer zone.[5] Thereafter, we use the calculated density scaled by the size, in acres, of the buffer zone to estimate the number of persons within the zone. Finally, we forecast future populations by increasing the population estimates using county-specific, 20-year population projections from the California Department of Finance (2024) for Butte and San Diego counties. The population projections for Ventura County show a decrease of approximately 5 percent over the next 20 years. In practice, it is unlikely that a planner would scale down the size of a resilience measure based on population projections; thus, we do not adjust the energy demand estimate for the Thomas Fire.
We next estimate the capacity using an estimated capacity factor. Capacity factor is a unitless measure of real energy output over theoretical maximum energy output, and it varies by energy source. For example, nuclear energy has the highest capacity factor of 92.7 percent, on average, while solar photovoltaic has a capacity factor of 24.4 percent (USEIA, no date). Microgrids typically use a variety of distributed energy sources, so we estimate a single capacity factor using a weighted average technique. NREL’s Phase I microgrid cost study provides average generation by source for a community microgrid (Giraldez et al. 2018), which we weight by its respective capacity factor.[6]
After estimating the capacity, we then use energy demand data for the county and year in which the fire occurred (California Energy Commission, no date) and divided these demand estimates by population data for the same year from the U.S. Census Bureau to estimate a per-capita annual energy demand. Combined with our population estimates and capacity factor estimate, we use the typical capacity factor equation to estimate the required capacity of our theoretical microgrids:
We apply our estimate of the capacity factor for the distributed energy systems included in an average microgrid, as described previously, and incorporate the annual energy demanded by the population in the numerator. The latter is the per-capita energy demand scaled by the population in the 1-mile band around the approximate ignition point.
Table 3 summarizes the estimated microgrid capacities for each of the fires.
| Table 3. Estimated Microgrid Capacities | |
| Fire | Estimated Microgrid Capacity (MW) |
| Camp Fire | 2.44 |
| Thomas Fire | 4.00 |
| Witch Fire | 0.72 |
We scale the microgrid cost estimates per component by our estimated capacity figures. Once the microgrid is operational, we use 7.5 percent of the construction costs to estimate annual operations and maintenance costs (Hildebrand 2020).
The last step is to determine land acquisition costs. The Blue Lake Rancheria Community microgrid acquired a 2-acre site for construction of its 0.5-acre solar photovoltaic array (Carter et al. 2019), which implies approximately 4 acres per megawatt of microgrid. We multiply the estimated microgrid capacity by this ratio to estimate the acres required for each microgrid. Finally, we estimate the cost of acquiring the land for each microgrid by multiplying the acres required by the average cost of commercial land per acre in California from LandSearch (2024) ($76,526 per acre). This figure is conservatively high, as land acquisition costs in remote or suburban areas, where microgrids are more likely to be, would be lower than the state average.
Breakeven Analysis
This analysis uses an expected value approach to estimate avoided losses. These avoided losses enter the benefit–cost analysis as benefits of the microgrids. That is, we multiply the probability of a wildfire occurring and becoming moderate or high in intensity in a specific area in each year by the total losses from the historical event. This approach provides an expected value of a wildfire, adjusted using the probability of it occurring. We apply a discount rate of 2 percent following guidance from the OMB’s Circular A-4 (OMB 2023). Then, we sum those expected loss values by year, which provides a cumulative expected loss value. Finally, we identify the point in time at which the cumulative value of discounted, expected, and avoided impacts equals or exceeds the cumulative discounted costs of constructing, operating, and maintaining a microgrid. That is, we identify the point in time t to satisfy the following equation:
![]()
In the equation, Bt is the benefits of the microgrid at time t (i.e., avoided impacts), Ct is the costs of the microgrid at time t, and δ equals 0.02 (2 percent). This point in time represents the breakeven point.
Figure 3 presents the estimated net benefits of the three hypothetical microgrids. All three microgrids show small negative net benefits for the first 2 years of the analysis period as the microgrids are being constructed. The microgrids become operational in Year 3 and are immediately cost beneficial. Even when weighted by extremely small wildfire ignition probabilities, the probability-weighted avoided losses (benefits) immediately exceed the costs of constructing and maintaining a microgrid.

Figure 3. Estimated Net Benefits
The slope of the estimated net benefits curve is indicative of the payoff rate of the microgrid. As expected, the Camp Fire—the most destructive wildfire of the three wildfires we consider—is also the one that would have realized the most avoided losses from the construction of a microgrid, followed by the Thomas Fire and the Witch Fire.
Cumulative Benefits
Table 4 summarizes the estimated cumulative discounted benefits (avoided losses) over the 10-year analysis period.
| Table 4. Cumulative Discounted Benefits (Avoided Losses) | |||||||
| Fire | Direct Capital Impacts | Health Impacts | Indirect Economic Losses | Fire Suppression | Deaths | Total | |
| Camp Fire | $1,105.2 | $1,279.7 | $3,431.8 | $16.6 | $98.7 | $5,932.0 | |
| Thomas Fire | $253.9 | $294.0 | $788.5 | $26.1 | $2.3 | $1,364.9 | |
| Witch Fire | $213.8 | $247.6 | $664.0 | $2.4 | $2.3 | $1,130.2 | |
Note: All values are reported as millions of 2024 dollars.
Avoided cumulative discounted direct capital losses range from $213.8 million to $1,105.2 million. The largest impacts are those related to avoided indirect economic losses, which range from $664.0 million to $3,431.8 million. The second-largest impacts are avoided health impacts, which range from $247.6 million to approximately $1,279.7 million. Cumulative discounted avoided fire suppression costs range from $2.4 million to $26.1 million, while the estimated value of cumulative discounted avoided deaths is valued between $2.3 million to more than $98.7 million.
Table 5 summarizes the estimated cumulative discounted costs of the three hypothetical microgrids.
| Table 5. Cumulative Discounted Costs | ||||
| Fire | Microgrid Construction | Operations and Maintenance | Land Acquisition | Total |
| Camp Fire | $4.7 | $2.5 | $0.7 | $8.0 |
| Thomas Fire | $7.7 | $4.2 | $1.2 | $13.1 |
| Witch Fire | $1.4 | $0.8 | $0.2 | $2.4 |
Note: All values are reported as millions of 2024 dollars.
Cumulative discounted costs of microgrid construction range from $1.4 million for the Witch Fire microgrid to approximately $7.7 million for the Thomas Fire microgrid, while discounted operations and maintenance costs for the same microgrids range from $0.8 million to $4.2 million. Land acquisition costs, the smallest costs for microgrid construction, range from $0.2 million for the Witch Fire area to approximately $1.2 million for the Thomas Fire area.
Finally, we also calculate the BCR of each microgrid, which is the ratio of the cumulative discounted benefits divided by the cumulative discounted costs. The higher the BCR, the higher the cost effectiveness of the mitigation option. Table 6 presents the BCRs for each of the hypothetical microgrids.
| Table 6. Benefit–Cost Ratios | |||
| Fire | Total Discounted Benefits (millions) | Total Discounted Costs (millions) | Benefit–Cost Ratio (unitless) |
| Camp Fire | $5,932.0 | $8.0 | 746.1 |
| Thomas Fire | $1,364.9 | $13.1 | 104.6 |
| Witch Fire | $1,130.2 | $2.4 | 476.5 |
According to the BCR estimates, all three microgrids are highly cost effective.[7] Even in the case where only the costs of fire suppression are included as avoided losses, the BCRs for all three microgrids are still positive (i.e., cost effective). Using the same burn probability of 1.54 percent and FLEP4 (for 4 ft) of 80.42 percent across all three fires, the Camp Fire microgrid is the preferred alternative when considering the BCR alone. If we increase the burn probability from 1.54 to 2.54 percent for the Witch Fire area and hold the other values constant, it increases the BCR for the Witch Fire microgrid from 476.5 to 786.4, making it more cost effective than the Camp Fire microgrid. This example again demonstrates the complexity of the decision process faced by decision-makers and the necessity of including all relevant available data in their analyses of the preferred location of resilience assets.
Discussion
A discussion of the analysis can be divided among the following categories:
Population Distribution and Microgrid Feasibility
This analysis does not examine population distribution in a detailed manner. Population distribution and density, however, are important characteristics of communities that should be addressed by decision-makers. The Witch Fire is an apt example of where this methodology falls short. The fire began in Witch Creek Canyon in a rural area of San Diego County with a low population density. In this case, a microgrid may not be the most cost-effective form of wildfire resilience because it would provide backup power to relatively few households in the event of a public safety power shutoff. In such a scenario, a more cost-effective approach may be to provide households with incentives to purchase and install generators or backup batteries that can be used during times of elevated wildfire risk. This provides a similar reduction in the disincentive for an electric utility to de-energize power lines by providing backup energy to households that choose to participate. This simple example demonstrates the need for idiosyncratic and site-specific analyses to determine the most appropriate backup power and incentive structure to ensure maximum adoption by households.
Grid Design and Microgrid Energy Capacity
This analysis uses a relatively simple approach to estimate the population affected by wildfire and the estimated energy demand that must be met by the microgrid. We do not have access to proprietary or detailed data regarding the design of the electrical grids surrounding our example wildfires, which means we do not have a precise understanding of where to best place the microgrid or the size of the population that would be protected. This data gap means that our microgrid capacity estimates are less accurate than they could be, given that the energy demand that must be met by the microgrid are based on the population protected. The estimated foregone losses (benefits) of the microgrids in this analysis rapidly exceed the costs of the microgrids, so this uncertainty does not fundamentally alter the conclusions of this study; however, this will not always be true, particularly when the value of the protected asset inventory is lower in value relative to the cost of the microgrid, which implies a longer payoff period for the microgrid.
Fairness in Resilience Funding
This analysis demonstrates some of the challenges of deploying energy-related disaster resilience funding in a fair and equitable manner. A significant fraction of the benefits of a microgrid in this analysis is a function of the insured value of the various structures and assets protected by the microgrid. As a result, microgrids protecting affluent communities will often appear to be more advantageous from a benefit–cost perspective than microgrids protecting poorer communities.
Consider a simple excursion analysis for the Thomas Fire in which we evaluate the impacts of installing a microgrid under a scenario in which the value of insured assets was 25 percent more valuable, which proxies for a hypothetical wealthier community, all other variables being equal. The discounted cumulative costs of the microgrid over the 10-year analysis period remain unchanged at $13.1 million, while the discounted cumulative benefits rise from approximately $1.4 billion to $1.7 billion. This demonstrates that, from the perspective of a benefit–cost analysis, a microgrid that protects a wealthy community will appear more attractive than an equivalent microgrid protecting a similarly sized but relatively poorer community, all other variables being equal (including wildfire probability). This conclusion is undesirable from an environmental and energy justice perspective. When implementing analyses similar to the approach we present in this analysis, utilities, government entities, and policymakers must incorporate environmental and energy justice considerations into decision-making processes to ensure that disaster risk reduction and energy resilience measures are appropriately distributed with a goal of achieving equity and fairness in the allocation of disaster resilience resources.
Impacts Not Considered in the Analysis
This analysis compares the benefits of constructing and implementing a hypothetical microgrid to the losses that would have been avoided had the microgrid been operational. These impacts include avoided direct capital impacts, health impacts, indirect economic losses, costs of fire suppression, and deaths. There are, however, many other benefits of microgrids and wildfire resilience that we do not address, including the following:
- Reduced environmental damages resulting from protected environmental capital and ecosystem services
- Reduced insurance costs and increased local investment resulting from reduced risk
- Reduced greenhouse gas emissions and protected carbon capture due to protected environmental assets
- Reduced risks of landslide-related impacts
- Reduced transportation and public infrastructure losses
- Reduced outbound migration and associated decreases in economic activity.
These benefits add up rapidly. For example, forests similar to those in California provide valuable ecosystem goods and services, such as food, recreation and tourism, habitat for plants and animals, and carbon sequestration, among others. The majority of these ecosystem goods and services—if not all—would be temporarily lost in a wildfire and significantly altered for a long time as the ecosystem recovers.
Conclusion
This paper presents an analysis of the cost-effectiveness of microgrid installation and implementation for high-risk communities. Using data from the Camp, Thomas, and Witch fires, we assess the construction and implementation of hypothetical microgrids. We use a simplified example to estimate the potential avoided losses if these microgrids had been operational during periods of elevated wildfire risk.
Our analysis demonstrates that, even under conservative assumptions, microgrid investments can be cost beneficial within a short time frame for communities with specific risk profiles. Interestingly, the region with the most valuable assets may not always be the most advantageous location for wildfire resilience investments. This finding has significant environmental and energy justice implications.
For communities with scattered populations or lower densities, microgrids might not be the most cost-effective solution. Localized or household-level solutions—like incentive programs or battery backup systems—could offer better cost-efficiency. Ultimately, the most suitable approach hinges on the specific wildfire risk profile of the community.
These example analyses are admittedly simple. We do not include many important impacts, the vast majority of which are additional avoided losses due to the wildfires. By including these additional avoided losses, the microgrids would all become more attractive from a benefit–cost standpoint. There are many such additional avoided losses that merit further attention in an effort to develop a more holistic accounting of wildfire damages that could be mitigated by strategic risk reduction measures.
The results of this analysis demonstrate that large upfront investments in disaster resilience are often a cost-beneficial approach to protecting communities against low-probability, high-consequence events. This approach applies beyond wildfire-related energy resilience and can be used for flood mitigation, coastal erosion, and other extreme weather events. It can be used by electric utility providers, regional governments, or local communities in decision-making processes to evaluate and prioritize disaster resilience investment alternatives in high-risk areas.
References
CAL FIRE. 2020. Wildfire activity statistics. California Department of Forestry and Fire Protection, Office of the State Fire Marshall. 2020. Sacramento, CA.
CAL FIRE. 2021. Wildfire activity statistics. California Department of Forestry and Fire Protection, Office of the State Fire Marshall. 2021. Sacramento, CA.
CAL FIRE. 2022. Wildfire activity statistics. California Department of Forestry and Fire Protection, Office of the State Fire Marshall. 2022. Sacramento, CA.
CAL FIRE. 2024. Top 20 most destructive California wildfires. California Department of Forestry and Fire Protection, Office of the State Fire Marshall, Sacramento, CA.
California Department of Finance. 2024. Total population for California and counties. Table P-2A. California Department of Finance, Sacramento, CA. https://dof.ca.gov/forecasting/demographics/projections/.
California Energy Commission. No date. Electricity consumption by county. https://ecdms.energy.ca.gov/elecbycounty.aspx. Accessed on March 5, 2024. California Energy Commission, Sacramento, CA.
Carter, D., J. Zoellick, M. Marshall, G. Chapman, P. Lehman, D. Saucedo, C. Chamberlin, S. Shoemaker, J. Ganion, and P. Singh. 2019. Demonstrating a secure, reliable, low-carbon community microgrid at the Blue Lake Rancheria. Final Project Report. Report CEC-500-2019-011. California Energy Commission, Energy Research and Development Division, Sacramento, CA. January. https://www.energy.ca.gov/sites/default/files/2021-05/CEC-500-2019-011.pdf.
Gantner v. Pacific Gas & Electric Corporation et al. 2023. Docket No. S273340. C.N. 21-15571. Ninth Circuit Court, Northern District of California.
Giraldez, J., F. Flores-Espino, S. MacAlpine, and P. Asmus. 2018. Phase I microgrid cost study: Data collection and analysis of microgrid costs in the United States. NREL/TP-5D00-67821. National Renewable Energy Laboratory, Golden, CO. October. https://www.nrel.gov/docs/fy19osti/67821.pdf.
Griffo, P. 2022. SCE-supported residential microgrid a first in California. Last updated on November 2, 2022. Edison International, Rosemead, CA. https://energized.edison.com/stories/sce-supported-residential-microgrid-a-first-in-california.
Hildebrand, J.P. 2020. Estimating the life cycle cost of microgrid resilience. Thesis. Naval Postgraduate School, Department of Systems Engineering. Monterey, CA. 115 pp.
III. 2023. Facts + Statistics: Wildfires. https://www.iii.org/fact-statistic/facts-statistics-wildfires. Accessed December 8, 2023. Insurance Information Institute, Malvern, PA.
IPCC. 2022. Climate Change 2022 – Impacts, Adaptation and Vulnerability. Contribution of Working Group II to the Sixth Assessment Report of the Intergovernmental Panel on Climate Change. Cambridge University Press, Cambridge, United Kingdom. 3056 pp. https://doi.org/10.1017/9781009325844.
Koran, M. 2019. California power outages could cost region more than $2bn, some experts say. The Guardian. October 11. https://www.theguardian.com/us-news/2019/oct/11/california-power-outages-cost-business-wildfires.
LandSearch. 2024. Price of land per acre. https://www.landsearch.com/price. Accessed March 5, 2024. LandSearch, Colorado Springs, CO.
Maranghides, A., and W. Mell. 2011. A case study of a community affected by the Witch and Guejito wildland fires. Fire Technology 47:379–420.
National Interagency Fire Center. 2018. National large incident year-to-date report. National Interagency Fire Center, Boise, ID. June 25. https://web.archive.org/web/20180725214408/https://gacc.nifc.gov/sacc/predictive/intelligence/NationalLargeIncidentYTDReport.pdf.
OMB. 2023. Circular A-4. U.S. Office of Management and Budget, Washington, DC.
Scott, J.H., J.W. Gilbertson-Day, C. Moran, G.K. Dillon, K.C. Short, and K.C. Vogler. 2020. Wildfire Risk to Communities: Spatial datasets of landscape-wide wildfire risk components for the United States. Last updated November 25, 2020. U.S. Department of Agriculture, Forest Service Research Data Archive, Fort Collins, CO. https://doi.org/10.2737/RDS-2020-0016.
Short, K.C. 2022. Spatial wildfire occurrence data for the United States, 1992–2020 [FPA_FOD_20221014]. Sixth edition. U.S. Department of Agriculture, Forest Service Research Data Archive, Fort Collins, CO. https://doi.org/10.2737/RDS-2013-0009.6.
Ton, D.T., and M.A. Smith. 2012. The U.S. Department of Energy’s microgrid initiative. The Electricity Journal 25(8):84–94. https://doi.org/10.1016/j.tej.2012.09.013.
U.S. Census Bureau. 2024. Explore Census Data. https://data.census.gov/. Accessed March 5, 2024. U.S. Census Bureau, Suitland, MD.
USEIA. No date. Electric Power Monthly. https://www.eia.gov/electricity/monthly/epm_table_grapher.php. Accessed March 6, 2024. U.S. Energy Information Agency, Washington, DC.
Wang, D., D. Guan, S. Zhu, M. Mac Kinnon, G. Geng, Q. Zhang, H. Zheng, T. Lei, S. Shao, P. Gong, and S. Davis. 2021. Economic footprint of California wildfires in 2018. Nat. Sustain. 4:252–260. https://doi.org/10.1038/s41893-020-00646-7.
[1] Public safety power shutoffs also result in legal challenges. In Gantner v. Pacific Gas & Electric Corporation et al. (2023), for example, the Supreme Court of California rejected a class action lawsuit against Pacific Gas & Electric (PG&E) for performing public safety power shutoffs during the 2019 wildfire season. The $2.5 billion lawsuit alleged that the power shutoffs yielded blackouts across PG&E’s service area, causing the “loss of habitability of their dwellings, loss of food items in their refrigerators, expenses for alternative means of lighting and power, . . . loss of cell phone connectivity, dangerous dark conditions, lack of running water, and loss of productivity and business” (Gantner v. Pacific Gas & Electric Corporation et al. 2023).
[2] The Blue Lake Rancheria microgrid increased its battery storage to 1.15 MW in 2019.
[3] For this exercise, we use probabilities from the Camp Fire area as the basis for all three fires: a burn probability of 1.54 percent and a flame length exceedance probability for 4 ft (FLEP4) of 80.4 percent. FLEP4 is a probability measurement such that, if a wildfire occurs, it will exceed 4 ft, indicating the potential for moderate-to-high wildfire intensity (Scott et al. 2020).
[4] The U.S. Office of Management and Budget (OMB) issues guidance to federal agencies regarding the development of benefit–cost analyses. Following OMB Circular A-4, we apply a discount rate of 2 percent to discount impacts incurred in future years (OMB 2023).
[5] These ignition points are within the urban–wildlife interface; thus, populations are likely underestimated.
[6] We use a simplifying assumption: the electricity generation mix will likely swing towards a greater proportion of renewable sources in the future in California.
[7] A project is considered cost effective when the BCR is 1.0 or greater.