
Integral Insights
EPA Revs Up ProUCL: How Will Your Site Be Affected?
By Melanie Edwards, PStat., Senior Solution Architect
Many people use statistics to summarize more recent data in hopes of understanding past activities, but as a formally trained statistician I consider how representative the statistic is of the underlying data. In the next few paragraphs, I explain the real-world ramifications of the changes in the new version of EPA’s ProUCL software and the effects of the changes on risk assessments.
What is ProUCL?
Risk assessments for contaminated sites use representative concentrations of contaminants in environmental media to estimate the increased risk from exposure at the site. ProUCL is a statistical software package developed by EPA that uses multiple statistical methods to generate 95 percent upper confidence limits on the mean (UCLs) chemical concentrations in environmental media, and then identifies the agency’s recommended method for calculating the 95 percent UCL for use in risk assessment.
EPA’s ProUCL v.5.2
The latest version, ProUCL version 5.2 released in June 2022, updates the agency’s decision logic for recommending which method is best for calculating the UCL. The main outcome of this change is a recommended UCL that generally tends to be lower than those generated from earlier versions of the software. Additional changes—not widely publicized—further alter the recommended concentrations in less predictable ways, sometimes increasing the value and other times decreasing it. To explore this, I tested 293 real data sets to assess the combined effects of the changes implemented in the new version of ProUCL.
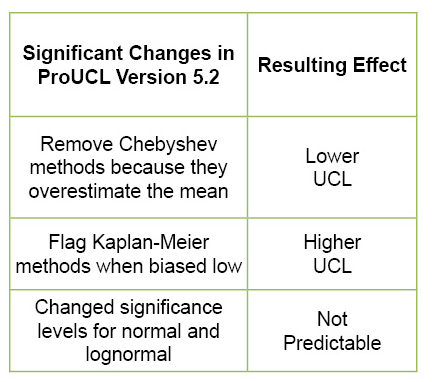
A key priority of previous versions of ProUCL was ensuring that the recommended UCL would provide adequate coverage—meaning the UCL exceeded the true mean at least 95 percent of the time. Research by Neptune and Company (2022), however, documented that the often-recommended Chebyshev method overestimates the mean and therefore the resulting UCL of that mean is higher than necessary to cover the true mean with 95 percent confidence.
Consequently, ProUCL version 5.2 no longer recommends the Chebyshev method, which should result in recommended UCLs that are closer to the true mean concentration. Overall, this shift should translate to fewer sites that are erroneously characterized as contaminated, when in fact they are not (i.e., fewer Type II errors).
Another important change in version 5.2 relates to selecting the statistical distribution that characterizes the data, which in turn determines the applicable UCL method. As with earlier versions of the software, normal, gamma, and lognormal distributions are assessed. The new release, however, retains a standard 5 percent significance level only for the gamma test. Normality is now rejected at 1 percent significance, and lognormality is rejected at 10 percent significance.
What does this mean in practice?
More data sets are identified as normal (i.e., it is more difficult to reject at 1 percent significance than at 5 percent), and fewer data sets are identified as lognormal (i.e., it is easier to reject at 10 percent significance than at 5 percent). For the data I evaluated, the recommended UCL values were lower by 10 percent or less than the recommended values from version 5.1 due to the increased use of normality-based methods.
In addition, if a data set does not pass for any of the three distributions, ProUCL version 5.2 most often recommends the normality-based t-statistic method. This practice also is expected to reduce the recommended UCL because the normal t-statistic method commonly produces a lower UCL than non-parametric methods and the previously recommended Chebyshev methods.
For data that are lognormally distributed, ProUCL version 5.2 uses Land’s H-statistic method instead of the Chebyshev methods that had been the prevalent recommendation in version 5.1 for smaller, moderately skewed data sets (N<50). Use of Land’s H-statistic also is expected to reduce the UCL, though it too can result in exceedingly high values. Users are encouraged to compare the recommended UCL with other UCL methods to ensure that the result is neither exceedingly high nor low.
Another important change in version 5.2 is the addition of cautionary notes when any of the Kaplan-Meier methods result in a biased-low UCL that may not be representative. Notably, ProUCL may still recommend Kaplan-Meier methods, despite the cautionary note. Again, users are encouraged to review the recommended UCL relative to other UCL methods.
As noted above, I tested nearly 300 data sets using versions 5.1 and 5.2. Most data sets that changed in version 5.2 to a normal distribution had been characterized as gamma in version 5.1, and most UCLs decreased by 10 percent or less. In contrast, data that had been characterized as lognormal in version 5.1 but did not fit a distribution in version 5.2 (because of the revised significance levels) yielded much different UCL concentrations (higher or lower). For example, in one data set, the recommended lognormal UCL in version 5.1 was 255 µg/kg, whereas the recommended UCL in version 5.2 was 1,270 µg/kg, based on a default assumption of normality despite a rejection of normality. For several other data sets, the recommended UCL increased by 50 percent or more, and for two data sets, the recommended UCL decreased by 20 and 23 percent.
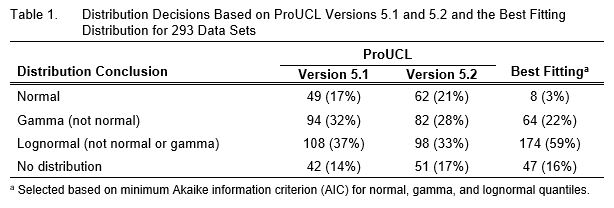
The distribution selections in all versions of ProUCL are hierarchical, evaluating for a normal distribution first, then gamma, and finally lognormal, rather than selecting the best fitting distribution. Given this order, lognormal-based UCLs are recommended by ProUCL only for data sets that do not follow a normal or gamma distribution. In contrast, most of the data I evaluated are best fit by a lognormal distribution. Table 1 shows the distribution selections for the 293 data sets evaluated based on ProUCL version 5.1 and version 5.2, and the best fitting distribution using a non-hierarchical approach. The best fitting distribution was identified as the minimum Akaike information criterion (AIC) for normal, gamma, and lognormal quantiles.
Takeaways
Based on my review and example data, the changes implemented in ProUCL version 5.2 can increase or decrease the recommended UCL concentration. No longer recommending the conservative Chebyshev method is supported by research and appropriately reduces the recommended UCL concentration. However, the compounding additional changes can result in larger magnitude effects on the recommended UCL, increasing and decreasing. Further, the distribution selection and recommended UCL method may not be justified or supported by the best-fitting distribution. These changes in combination may have substantial ramifications for contaminated site risk assessment and remediation decisions.
Contact Melanie Edwards at medwards@integral-corp.com to understand how the change could affect your site.
Published
November 4, 2022

Key Contact
Ms. Melanie Edwards is an accredited statistician who routinely provides insight on the interpretation of analyses and presentation of findings... Full bio