
Poster
A Novel Approach for Evaluating Optimal Groundwater-Surface Water Discharge Monitoring Periods for Source Control Evaluation in Portland Harbor
By David Livermore, R.G., L.H.G., Principal, Hydrology, Geosciences, and Chemistry
Poster presented at Battelle Sediments Conference, Jan 9-12, 2023, Austin, Texas
Background/Objectives
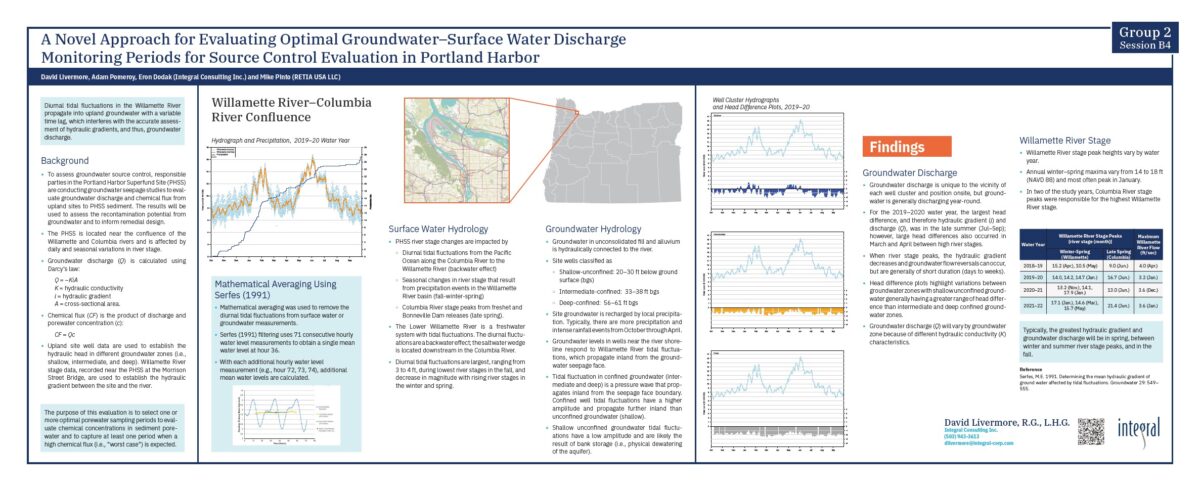
Responsible parties are evaluating the effectiveness of groundwater source control at dozens of industrial facilities along the Portland Harbor Superfund site (PHSS). For source control evaluation, parties are conducting temporal groundwater seepage studies to evaluate the groundwater and chemical flux from upland sites to PHSS sediments. For these evaluations, the regulatory agency, USEPA, wants to optimize one or more temporal sampling periods to evaluate an expected high flux (“worst case”) period. Groundwater flux can be calculated using Darcy’s Law and evaluating changes in the hydraulic gradient (i) between upland site wells and the Willamette River stage. Upland site well data can be used to establish the hydraulic head in different groundwater zones (i.e., shallow, intermediate, and deep). River stage monitoring data can be used to evaluate the river hydraulic head. Because the PHSS is located near the confluence of the Willamette and Columbia Rivers, daily and seasonal changes in river stage in the PHSS are complex and result from diurnal tidal fluctuations from the Pacific Ocean along with seasonal peak river stages that result from freshets in the Willamette River (mid-winter) and Columbia River (late spring).
Approach/Activities
To evaluate daily and seasonal changes in expected flux along the Willamette River within the PHSS, hourly water level data from a PHSS facility’s site wells and the Willamette River at the Morrison Street gauge were used. To deconvolute the tidal data from the long-term water level trends, a novel approach using Serfes filtering (1991) was used to remove the tidal fluctuations from the data set. The filtered data sets for both wells and river were then compared by calculating the head difference for well clusters near the top of the back and the river at several locations along the riverbank. The resulting head difference charts were used to visually evaluate periods of expected high- and low- flux in multiple groundwater zones using data for recent years. These charts were used to evaluate and select optimal periods for temporal monitoring of groundwater and chemical flux using seepage meters at the site.
Results/Lessons Learned
The results of the evaluation provided more than two years of data that were evaluated to select optimal seasons for seepage meter monitoring. Flux rates varied in the three groundwater zones daily and seasonally throughout the year, and each year varied depending on river stage changes as a result of changes in rainfall and climate. Periods of highest river stage as a result of the Willamette and Columbia River freshets tended to not be optimal for seepage meter deployment; however, periods of larger flux were available during most seasons of the year, with the early spring and fall providing more reliable longer-term “worst-case” flux periods. This methodology can also be effectively used to evaluate daily head differences and can be compared to seepage meter measurements after sampling is completed.
Published
January 10, 2023

About The Author
Mr. David Livermore is a principal hydrogeologist and geochemist with 30 years of experience in solving complex earth science problems... Full bio