
Press Release
Announcing: Interactive Applications—What Can Your Data Tell You?
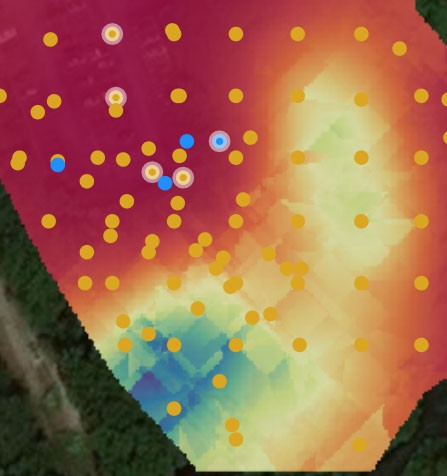
Our analytics team works to clearly communicate scientific results, design plans, and strategies through the use of innovative and engaging visualizations. We now bring data and results to your fingertips using interactive applications that weave together maps, figures, tables, and imagery, customized to pinpoint the answers to your questions.
Visualize, Communicate, Explore
Our applications integrate and connect information across multiple levels and sources to link together:
- Contaminants and their pathways
- Human and ecological risk scenarios
- Field results on interconnected maps
- Fate/transport and ecological modeling results
- Remedial scenarios
- Historical imagery
Our tools are easy to use, cost-effective, secure, and tailored to your needs.
Try a demo application.
We set ourselves apart by combining in-depth experience with cutting-edge tools to integrate data with strategic thinking to support informed decision making.
“With advances in technology and computing power, more information is available than ever before,” says environmental scientist Kenia Whitehead, Ph.D. “We help clients explore and understand their information holistically and in real-time through an interactive interface facilitating communication and sparking new insights.”
For more information contact Dr. Whitehead at kwhitehead@integral-corp.com or Dr. Brandon Sackmann at bsackmann@integral-corp.com or visit https://envision.staging-integralconsulting-stage.kinsta.cloud.